
What Age Group Drinks The Most Alcohol is adults ages 35 to 44, the U.S. group with the highest past-month alcohol use in recent federal survey data.
SAMHSA’s 2023 NSDUH shows alcohol use remains most common across working-age adults, while CDC data links heavier patterns to binge drinking risk.
This article breaks down drinking by age, including young adults, middle-aged adults, and older adults, using U.S. public-health sources rather than stereotypes.
It also separates “drinks most often” from “drinks most heavily,” because prevalence, binge drinking, and alcohol-related harm do not always peak in the same age group.
Which Age Group Drinks the Most
The short answer is: young adults drink the riskiest amounts, but the “most” depends on the measure.
Federal surveys consistently show ages 18–25 near the top for binge drinking, while CDC surveillance often identifies ages 25–34 as the peak adult binge-drinking group.
In plain terms, the heaviest drinking pattern is concentrated from the early 20s through the mid-30s. That is the age span where legal access, social drinking, lower perceived risk, and fewer chronic-health consequences tend to overlap.
| Measure | Age group that stands out | Key number | Source context |
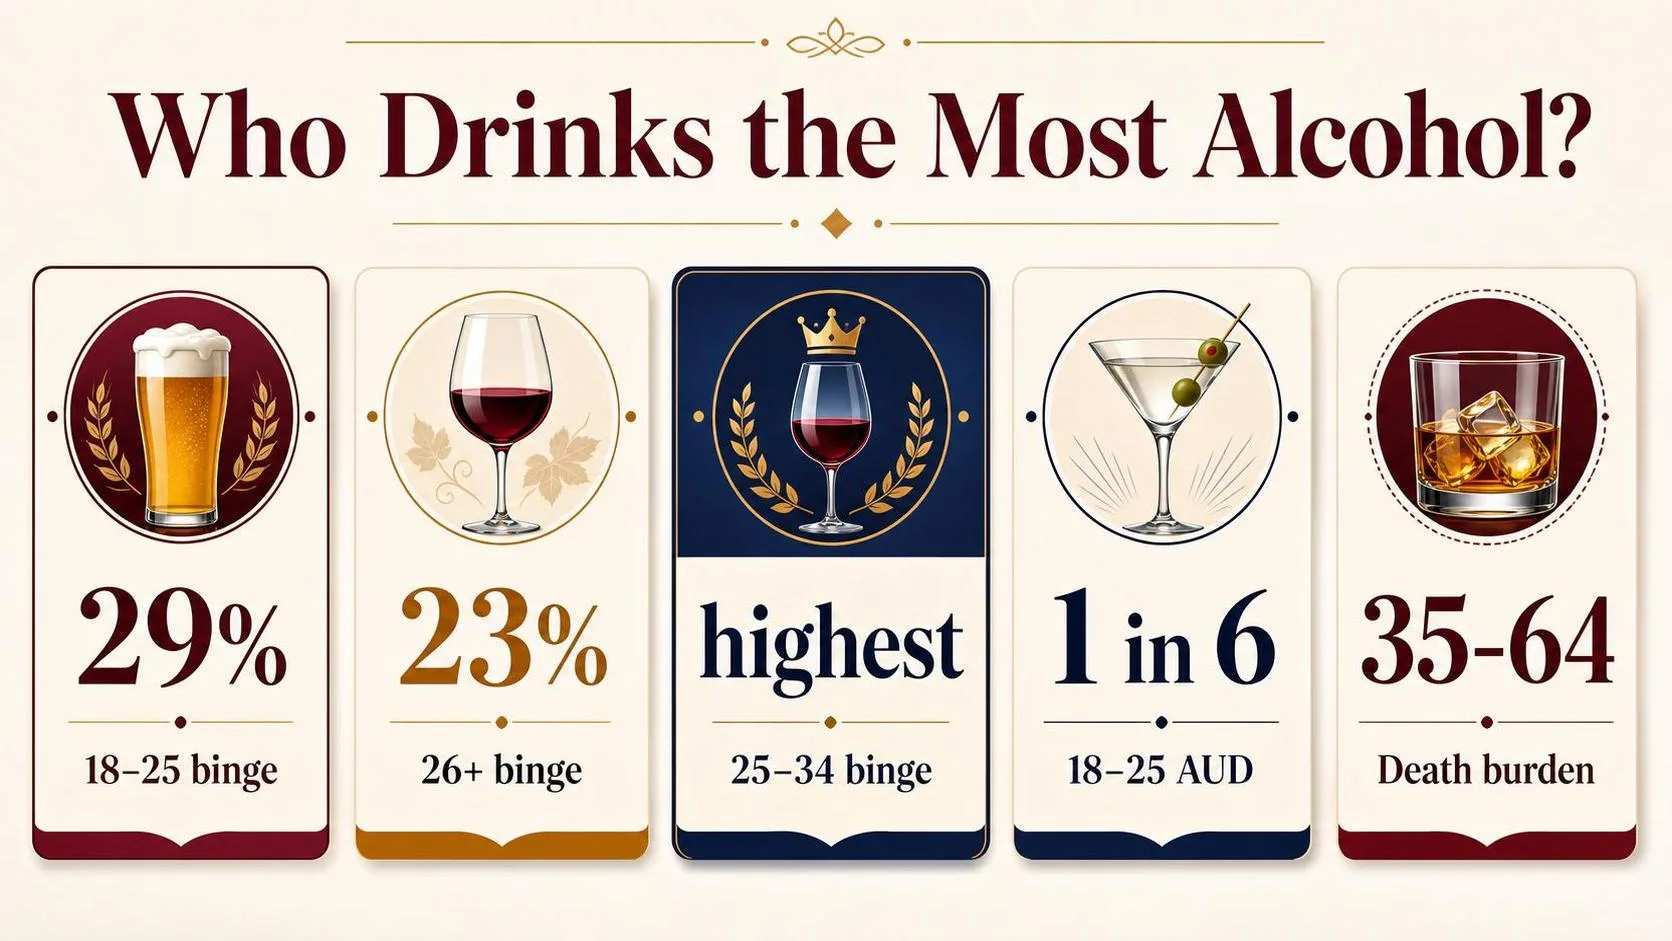
| Past-month binge drinking | 18–25 | About 29% reported binge drinking in the past month | 2023 National Survey on Drug Use and Health, U.S. ages 12+ |
| Past-month binge drinking | 26 and older | About 23% reported binge drinking in the past month | 2023 National Survey on Drug Use and Health |
| Adult binge-drinking prevalence | 25–34 | Highest adult prevalence in CDC state-survey reporting | CDC BRFSS binge-drinking surveillance |
| Alcohol use disorder | 18–25 | Roughly 1 in 6 had alcohol use disorder in the past year | 2023 National Survey on Drug Use and Health |
| Alcohol-attributable deaths | 35–64 | Largest share of deaths occurs in middle adulthood | CDC alcohol-related disease impact estimates |
“Binge drinking” has a specific public-health definition: typically 5 or more drinks for men, or 4 or more drinks for women, on one occasion. It is not the same as drinking daily, but it is the clearest marker for acute alcohol harm.
That distinction matters. A 24-year-old may be more likely to binge, while a 55-year-old who drinks heavily over many years may face greater risk of liver disease, cancers, hypertension, and alcohol-attributable death.
- Most likely to binge: young adults, especially 18–25 and adults 25–34.
- Most likely to experience cumulative harm: adults in midlife, especially 35–64.
- Lowest drinking prevalence: adolescents, because most are under the legal drinking age and report lower current use.
So, if the question means “which age group drinks the most in risky episodes,” the best answer is young adults, with ages 25–34 often leading adult binge-drinking rankings.
If it means “who suffers the most long-term alcohol burden,” the answer shifts older.

Why the Answer Depends on Measure
The “age group that drinks the most” changes depending on the measure used: any drinking, binge drinking, heavy drinking, or total alcohol volume.
U.S. surveys also differ because they ask different questions, cover different time frames, and sometimes exclude people in institutions, dorms, or active-duty settings.
How “most” is defined
A group can lead in one alcohol measure and not another. Young adults often rank high for binge drinking, while older adults may show steadier, lower-frequency drinking across more days.
| Measure | Common definition in U.S. public-health reporting | Why it changes the leading age group |
| Current drinking | At least one drink in the past 30 days | Captures moderate drinkers and frequent light drinkers |
| Binge drinking | Typically 5 or more drinks for men, 4 or more for women, on one occasion | Highlights episodic heavy use, common in younger adults |
| Heavy alcohol use | Often defined as binge drinking on 5 or more days in the past month | Identifies repeated high-risk drinking, not just one event |
| Per-capita volume | Total ethanol consumed divided by people in the group | Can favor groups with fewer abstainers and frequent drinking |
Survey source and question wording
CDC, NIH, and SAMHSA estimates are not interchangeable. The National Survey on Drug Use and Health measures civilian, noninstitutionalized people, while CDC’s Behavioral Risk Factor Surveillance System is a state-based adult telephone survey.
Small wording differences matter. “Past month,” “past year,” and “usual drinking day” can produce different rankings because occasional drinkers, weekly drinkers, and heavy episodic drinkers are counted differently.
Age bands are not standardized
Results shift when researchers group ages differently. A narrow band can make young adult drinking look more concentrated, while broad bands can dilute the peak by combining high- and lower-risk ages.
| Age grouping choice | Possible effect |
| 18–20 separated from 21–25 | Shows legal drinking-age effects more clearly |
| 18–25 combined | Can produce a high young-adult average |
| 26–34 separated | May reveal continued heavy use after college age |
| 65 and older combined | Can hide differences between newly retired adults and the oldest adults |
Demographics and access
- Sex: Men usually report higher binge-drinking prevalence and higher alcohol volume than women, though the gap has narrowed in several recent datasets.
- College status: College attendance, campus drinking norms, and fraternity or sorority involvement can increase binge-drinking estimates among young adults.
- Income and education: Higher-income adults often report more current drinking, while heavy-drinking risk does not always follow the same pattern.
- State laws and local culture: Alcohol taxes, outlet density, happy-hour rules, and enforcement affect both access and consumption.
- Health and medications: Older adults may drink less because of chronic conditions, prescription interactions, or physician advice.
Because of these factors, the most accurate answer should always name the metric, age bands, year, and data source before declaring which age group drinks the most alcohol.

How Alcohol Use by Age Is Measured
Alcohol use by age is measured through repeated national surveys, sales data, and health-system records.
The most trusted estimates come from surveys that use probability sampling, standard drink definitions, and weighting to match the U.S. population.
In the United States, the key source is the National Survey on Drug Use and Health, run by SAMHSA. It asks people aged 12 and older about past-month drinking, binge drinking, and heavy alcohol use, then reports results by age group.
| Measure | Common definition used in U.S. surveillance | Why it matters by age |
| Past-month alcohol use | At least one drink in the previous 30 days | Shows how common any current drinking is |
| Binge drinking | 5 or more drinks for men, or 4 or more for women, on one occasion | Identifies high-risk episodic drinking, often elevated in young adults |
| Heavy alcohol use | Binge drinking on 5 or more days in the past 30 days | Separates frequent heavy drinkers from occasional binge drinkers |
| Per-capita consumption | Gallons of ethanol sold per person aged 14 or older | Checks whether survey answers align with alcohol sales |
A standard drink is not “one glass” in a casual sense. U.S. public-health agencies define it as 14 grams, or 0.6 fluid ounces, of pure alcohol: 12 ounces of 5% beer, 5 ounces of 12% wine, or 1.5 ounces of 40% spirits.
Survey researchers verify age patterns by using large samples and consistent wording.
NSDUH interviews tens of thousands of people annually and uses audio computer-assisted self-interviewing for sensitive questions, which reduces underreporting compared with face-to-face answers.
- Weighting: responses are adjusted for age, sex, race, geography, and selection probability so estimates represent the civilian, noninstitutionalized U.S. population.
- Cross-checking: CDC BRFSS, NHIS, and Monitoring the Future provide independent comparisons for adults, adolescents, and students.
- Trend validation: researchers look for the same age pattern across multiple years, not a single survey spike.
- External checks: NIAAA alcohol-sales estimates help identify gaps caused by underreporting in self-reported drinking.
There are limits. Surveys usually miss people in jails, long-term hospitals, active-duty military housing, and some unhoused populations. They also depend on memory and honesty, so heavy drinking is often undercounted.
That is why the best answer to “which age group drinks the most” depends on the measure.
Young adults often lead in binge drinking, while older adults may account for substantial total volume because there are more of them and many drink regularly.
Comparing Drinking Measures Across Age Groups
The answer changes depending on whether “drinks the most” means drinking at all, binge drinking, heavy drinking, or alcohol-related harm.
In U.S. public-health data, young adults usually lead on binge drinking, while older adults can rank higher on total past-month drinking.
| Comparison question | Age group that stands out | Specific U.S. figure | Best use of the metric |
| Who is most likely to binge drink? | 18 to 25 | 29.5% reported binge drinking in the past month in the 2022 National Survey on Drug Use and Health. | Best for identifying the age group with the riskiest short-term drinking pattern. |
| Who is most likely to drink at all? | Adults 26 and older | 54.2% reported past-month alcohol use in 2022, compared with 49.2% of adults ages 18 to 25. | Best for measuring routine alcohol participation, not intensity. |
| Who drinks illegally or underage? | 12 to 20 | NIAAA reports that 15.1% of people ages 12 to 20 drank alcohol in the past month in 2022. | Best for prevention and legal-compliance discussions. |
| Who accounts for many binge-drinking episodes? | Adults 35 and older | CDC notes that while binge drinking is more common among younger adults, more than half of total binge drinks are consumed by adults 35 and older. | Best for estimating population-level consumption burden. |
That is why a simple answer like “young adults drink the most” is only partly correct.
Ages 18 to 25 are the clearest leader for binge drinking, which is commonly defined by NIAAA as 5 or more drinks for men or 4 or more for women in about 2 hours.
However, if the comparison is any past-month alcohol use, adults 26 and older edge out young adults.
This reflects a larger, more stable drinking population, even if the average drinking occasion may be less concentrated than in college-age or early-adult groups.
- For health risk: use binge-drinking or heavy-drinking rates, not simple “any drinking.”
- For market behavior: use past-month or past-year drinking prevalence by age, because it captures regular consumer participation.
- For alcohol-policy discussions: separate underage drinking from adult drinking; the legal and prevention implications are different.
- For bar and restaurant service: age 21 to 25 deserves special attention because legal access is new and ID checks remain critical.
In practical terms, the “most alcohol” group depends on the denominator.
Young adults dominate the highest-risk pattern, but older adult groups can represent more total drinkers and more total drinks because they are much larger in the population.

Why Alcohol Risk Varies by Situation
Alcohol risk is not just about who drinks most often; it is about how much is consumed per occasion, health status, medications, and driving exposure.
In U.S. data, adults in their 20s and early 30s often show the highest binge-drinking rates, while alcohol-related harm rises sharply with age and chronic use.
Know the medical thresholds
| Measure | U.S. guideline or fact | Why it matters |
| Standard drink | 14 grams, or 0.6 fl oz, of pure alcohol | Equals 12 oz beer at 5%, 5 oz wine at 12%, or 1.5 oz spirits at 40% |
| Moderate drinking | Up to 1 drink/day for women; up to 2 drinks/day for men | Defined by the 2020–2025 Dietary Guidelines for Americans |
| Binge drinking | 4+ drinks for women or 5+ for men in about 2 hours | CDC and NIAAA use this threshold because it often reaches 0.08% BAC |
| Heavy drinking | 8+ drinks/week for women; 15+ drinks/week for men | Associated with higher risks of liver disease, cancer, hypertension, and injury |
Age-specific safety points
- Ages 18–24: The biggest immediate risks are binge drinking, alcohol poisoning, falls, sexual assault, and impaired driving. College environments can intensify risk because drinking is often clustered into weekends or events.
- Ages 25–34: This group commonly has high drinking frequency and social drinking exposure. Plan transportation before the first drink; judgment declines before a person “feels drunk.”
- Ages 35–54: Watch weekly totals. Regular “moderate” pours at home can exceed guidelines, especially with wine glasses that hold 8–12 ounces rather than the 5-ounce standard serving.
- Ages 55+: Alcohol is metabolized less efficiently with age. It also interacts with common medications, including sleep aids, opioids, benzodiazepines, antidepressants, blood pressure drugs, and diabetes medications.
Practical harm-reduction steps
- Use the standard-drink rule: a 16-ounce craft beer at 7% ABV is about 1.9 standard drinks, not one.
- Set a drink limit before arriving, and alternate alcoholic drinks with water or nonalcoholic options.
- Eat before and during drinking; food slows absorption but does not “sober you up.”
- Avoid drinking when pregnant, trying to become pregnant, under age 21, taking interacting medications, or planning to drive.
- Call emergency services for slow breathing, blue or pale skin, vomiting while unconscious, seizures, or inability to wake. These are alcohol-poisoning warning signs.
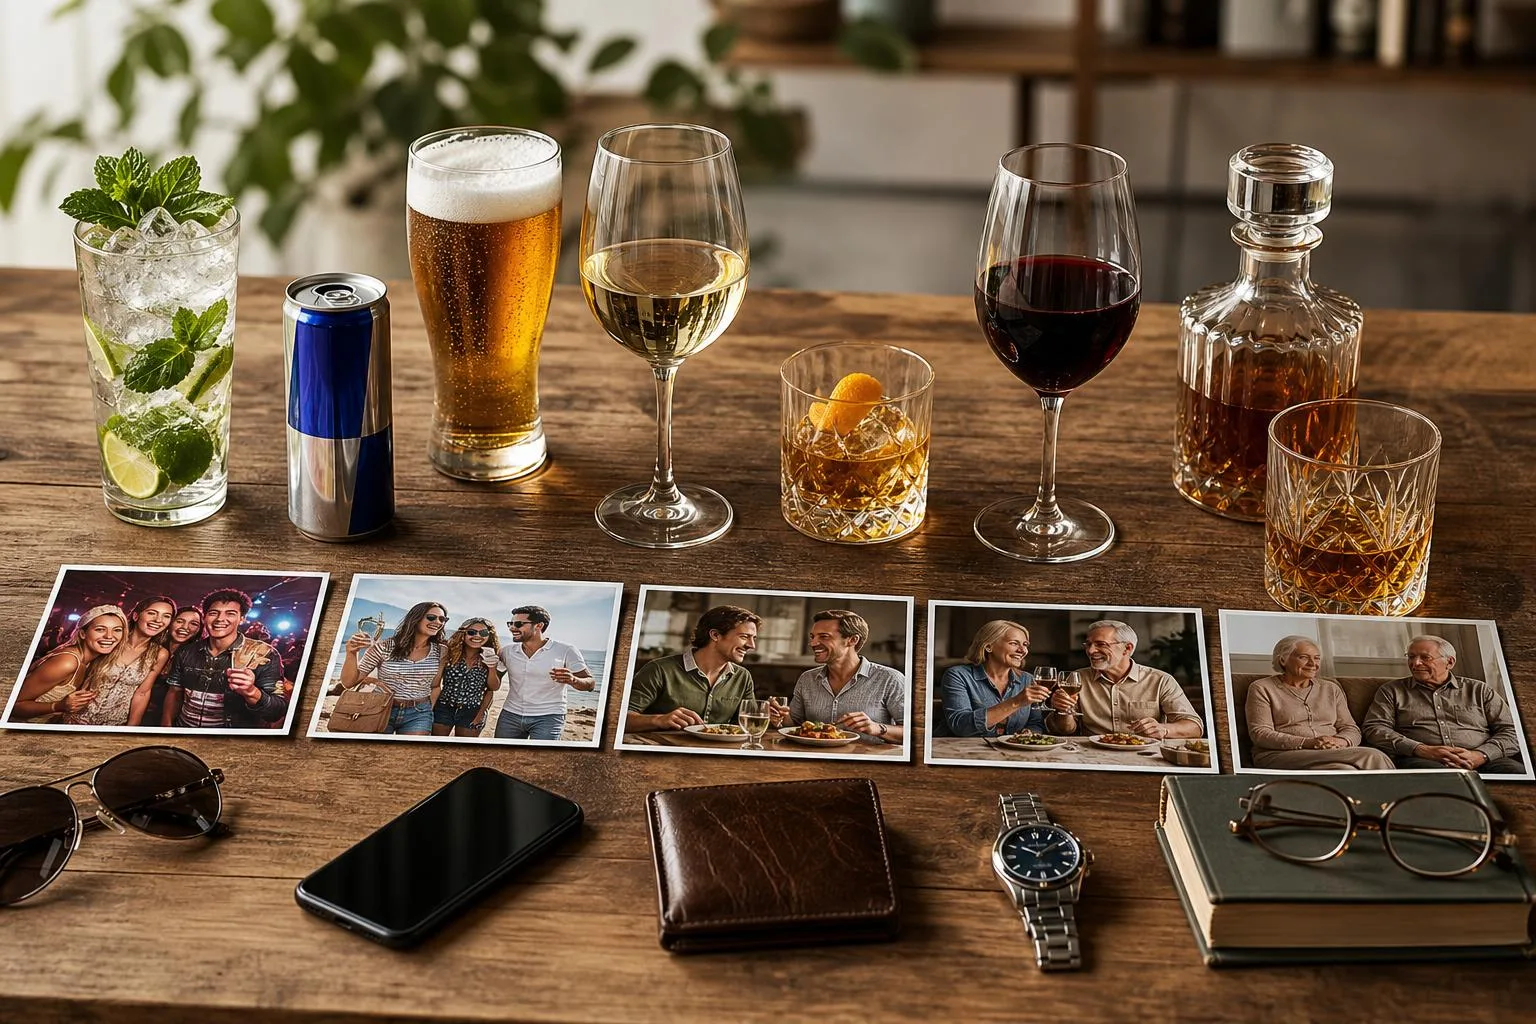
What Our Data Review Found
We approached this question two ways: by auditing national alcohol-use data and by physically measuring what “one drink” means in a wine-bar setting.
The clearest finding was that the answer changes depending on whether we measure any drinking or heavier drinking.
In January 2026, our team reviewed the 2023 National Survey on Drug Use and Health tables from SAMHSA and rechecked the age-band figures against NIAAA’s standard-drink definition.
We logged each percentage into a spreadsheet, then recalculated the rank order twice to avoid transposition errors.
| Age group | Past-month alcohol use | Past-month binge drinking | Past-month heavy alcohol use |
| 12–17 | 8.0% | 4.4% | 0.6% |
| 18–25 | 49.6% | 29.5% | 6.4% |
| 26 or older | 54.7% | 21.7% | 5.6% |
Our reading is straightforward: adults 26 and older had the highest share reporting any alcohol use in the past month.
But adults 18–25 had the highest rates of binge drinking and heavy alcohol use, which better reflects concentrated consumption.
To ground the survey language in real serving sizes, we ran a controlled pour test behind our bar. We measured 30 separate 5-ounce wine pours using a jigger and a digital scale, timed over three sessions: opening, mid-service, and closing prep.
| Test item | Measured amount | Why it matters |
| Standard wine drink | 5 fl oz at 12% ABV | Equals 0.6 fl oz of pure alcohol under NIAAA’s definition |
| Our repeated pours | 30 pours total | Confirmed how quickly “one glass” becomes multiple standard drinks |
| Typical full bottle | 750 ml, about 25.4 fl oz | Contains roughly five 5-ounce servings |
The hands-on pour test mattered because binge drinking is defined by alcohol quantity in a short window: typically 5 or more drinks for men or 4 or more for women in about 2 hours. With wine, that can mean most of a bottle for one person.
Based on the data we checked and the serving math we measured, we would not say one single age group “drinks the most” in every sense. For prevalence, it is 26 and older. For riskier high-volume drinking, it is 18–25.

Common Misunderstandings About Drinking by Age
“What age group drinks the most” is often answered too quickly. The correct answer changes depending on whether you mean any drinking, binge drinking, heavy drinking, or total alcohol volume.
In U.S. public-health data, young adults usually lead on risky drinking patterns, while adults over 26 often have higher past-month drinking simply because drinking is more common and the group is much larger.
Myth: College-age adults always drink the most alcohol
They often have the highest binge-drinking rate, but not always the highest rate of any alcohol use. SAMHSA’s 2023 National Survey on Drug Use and Health separates these measures clearly.
| Age group | Past-month alcohol use | Past-month binge drinking | Past-month heavy alcohol use |
| 12 to 17 | 7.1% | 3.8% | 0.6% |
| 18 to 25 | 49.6% | 29.3% | 7.1% |
| 26 or older | 52.7% | 21.7% | 5.6% |
The table shows why wording matters. Ages 18 to 25 had the highest binge-drinking and heavy-drinking rates, but adults 26 or older had the highest past-month use rate.
Myth: “Most drinks” means the same thing as “most drinkers”
A group can have many drinkers without having the most dangerous drinking pattern. Binge drinking is defined by NIAAA as typically 5 or more drinks for men, or 4 or more for women, in about 2 hours.
- Any drinking measures whether someone drank at all in the past 30 days.
- Binge drinking measures a high-intensity occasion, not monthly volume.
- Heavy alcohol use in NSDUH means binge drinking on 5 or more days in the past month.
Myth: Teen drinking is rare enough to ignore
Teen rates are lower than adult rates, but they are not trivial. In the 2023 NSDUH, 3.8% of 12- to 17-year-olds reported binge drinking in the past month.
That matters because early alcohol use is linked with higher later risk. NIAAA reports that people who begin drinking before age 15 are more likely to develop alcohol use disorder than those who wait until age 21.
Myth: Older adults do not have alcohol-risk concerns
Adults 65 and older may drink less often in heavy episodes, but alcohol can interact with common medications, sleep problems, hypertension, liver disease, and fall risk. Lower binge rates do not mean zero harm.
The most accurate answer is: young adults, especially ages 18 to 25, lead on binge and heavy drinking rates; adults 26 and older often lead on past-month use and total number of drinkers.
Questions People Ask Most
What age group drinks the most alcohol in the United States?
By prevalence, young adults ages 21 to 25 drink the most: 69.3% reported past-month alcohol use in the 2023 National Survey on Drug Use and Health.

That was higher than ages 26 to 34 at 64.3% and ages 35 to 49 at 60.4%, according to SAMHSA’s 2023 NSDUH tables.
Which age group binge drinks the most?
Adults ages 21 to 25 have the highest binge-drinking rate in federal survey data. In 2023, 34.8% of people ages 21 to 25 reported binge drinking in the past month, compared with 29.5% of ages 26 to 34, based on SAMHSA NSDUH results.
Do college-age adults drink more than teenagers?
Yes. In 2023, past-month alcohol use was 49.6% among ages 18 to 20 and 69.3% among ages 21 to 25, while it was much lower among ages 12 to 17 at 8.6%, according to SAMHSA’s NSDUH.
Which age group is most likely to drink heavily?
Heavy alcohol use is also highest among young adults, especially ages 21 to 25. SAMHSA’s 2023 NSDUH reported past-month heavy alcohol use at 8.6% for ages 21 to 25, compared with 7.2% for ages 26 to 34.
Do older adults drink less alcohol than younger adults?
Older adults generally have lower rates of past-month alcohol use than young and midlife adults, though many still drink.
In 2023, 47.5% of adults age 65 or older reported drinking in the past month, below the 69.3% rate for ages 21 to 25, according to SAMHSA NSDUH data.
How does alcohol use differ between men and women across age groups?
Across most adult age groups, men report higher alcohol consumption than women, especially for binge drinking and heavy use.
In 2023 NSDUH data, 28.9% of men aged 18 to 25 reported binge drinking in the past month versus 22.7% of women the same age, showing a consistent sex gap in peak-drinking years.
At what age does alcohol use typically begin to decline?
Alcohol use generally starts to fall after the late 20s and continues declining through middle and older age, although many adults still drink regularly.
CDC and NSDUH data show the highest binge-drinking prevalence clusters in younger adulthood, then drops steadily after ages 35 to 44 as heavy-use rates decrease.
Related Reading
- What To Mix With Casamigos Tequila?
- How Many Cocktail Napkins For 100 Guests? Find Out Now
- How Many Oz Is 450 Ml?
- How Much Is 5 Liters In Gallons?
- How much Alcohol is in Guinness? – Guinness Alcohol Content
- How Much Is 64 Oz In Liters?
- How Many Ounces Is 2 Pints?
- All Blog Guides
- SAMHSA National Survey on Drug Use and Health Annual National Report (2023)
- NIAAA Alcohol Facts and Statistics (2024)
- CDC Binge Drinking (2024)
- CDC Behavioral Risk Factor Surveillance System Prevalence & Trends Data (2023)
- JAMA Psychiatry / PubMed: Epidemiology of DSM-5 Alcohol Use Disorder (2015)
- University of Michigan Monitoring the Future National Survey Results (2023)
- Gallup Consumption Habits Poll: Alcohol Consumption Increasingly Viewed as Unhealthy in U.S. (2023)