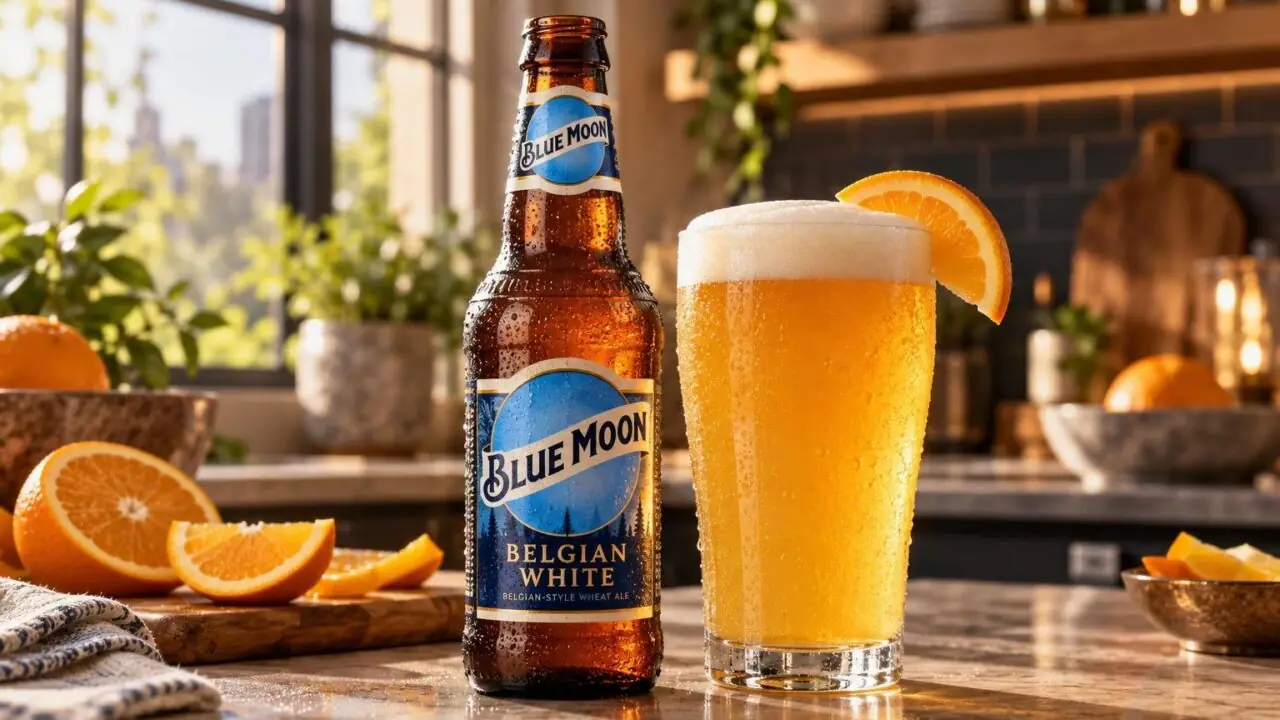
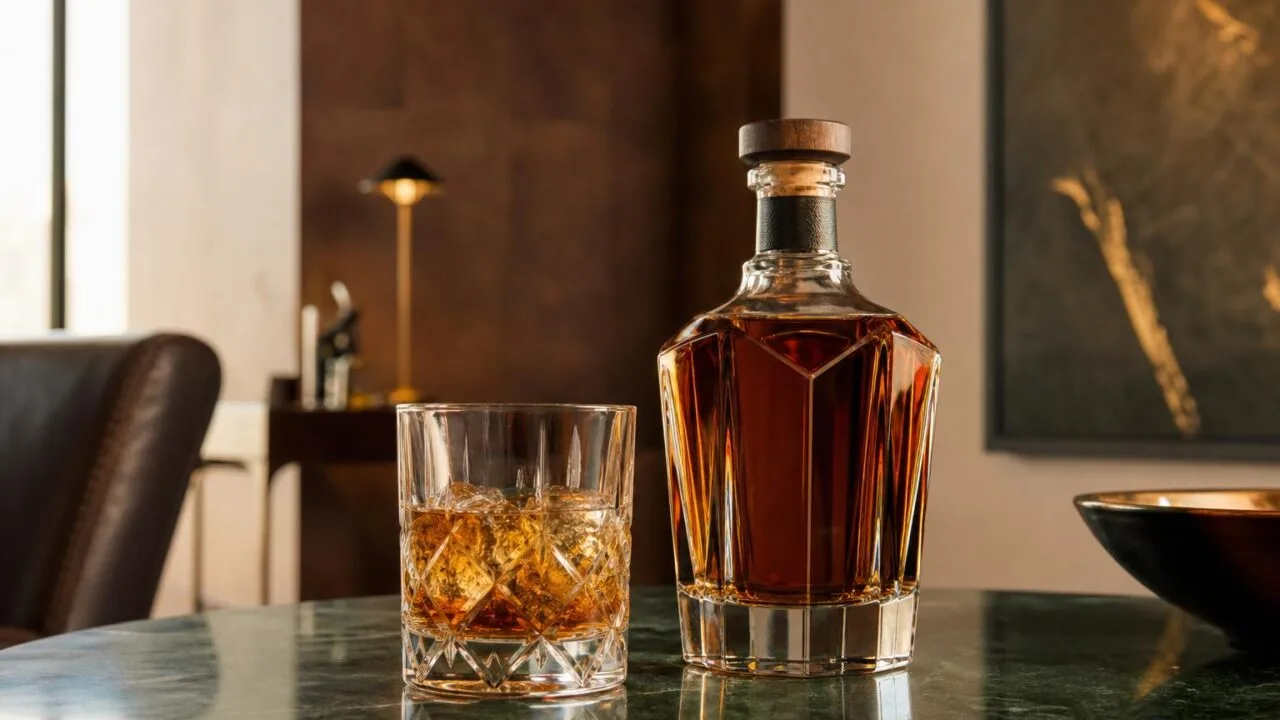
The Most Popular Alcohol is beer, the world’s most widely consumed alcoholic drink by volume, spanning lagers, ales, stouts, wheat beers, and regional styles served in bars, restaurants, stadiums, and homes.
Global alcohol data consistently shows beer ahead of wine and spirits in total liters consumed, even as preferences vary sharply by country.
Popularity is not the same as strength, prestige, or sales value. Spirits often dominate in alcohol content and premium pricing, while wine leads in specific dining cultures.
This article compares beer, wine, spirits, and ready-to-drink beverages using consumption patterns, market data, and real-world drinking occasions.
Ways to Define Popular Alcohol
“Most popular alcohol” depends on whether you measure volume, servings, retail dollars, or drinker preference.
By global volume, beer dominates; by alcohol content, spirits account for a larger share because they are much stronger per ounce.
The clearest baseline comes from the World Health Organization and U.S. industry data: beer leads in drinking occasions, while spirits and wine matter more in alcohol-per-volume and revenue comparisons.
| Measure | Leader | Key number | Why it matters |
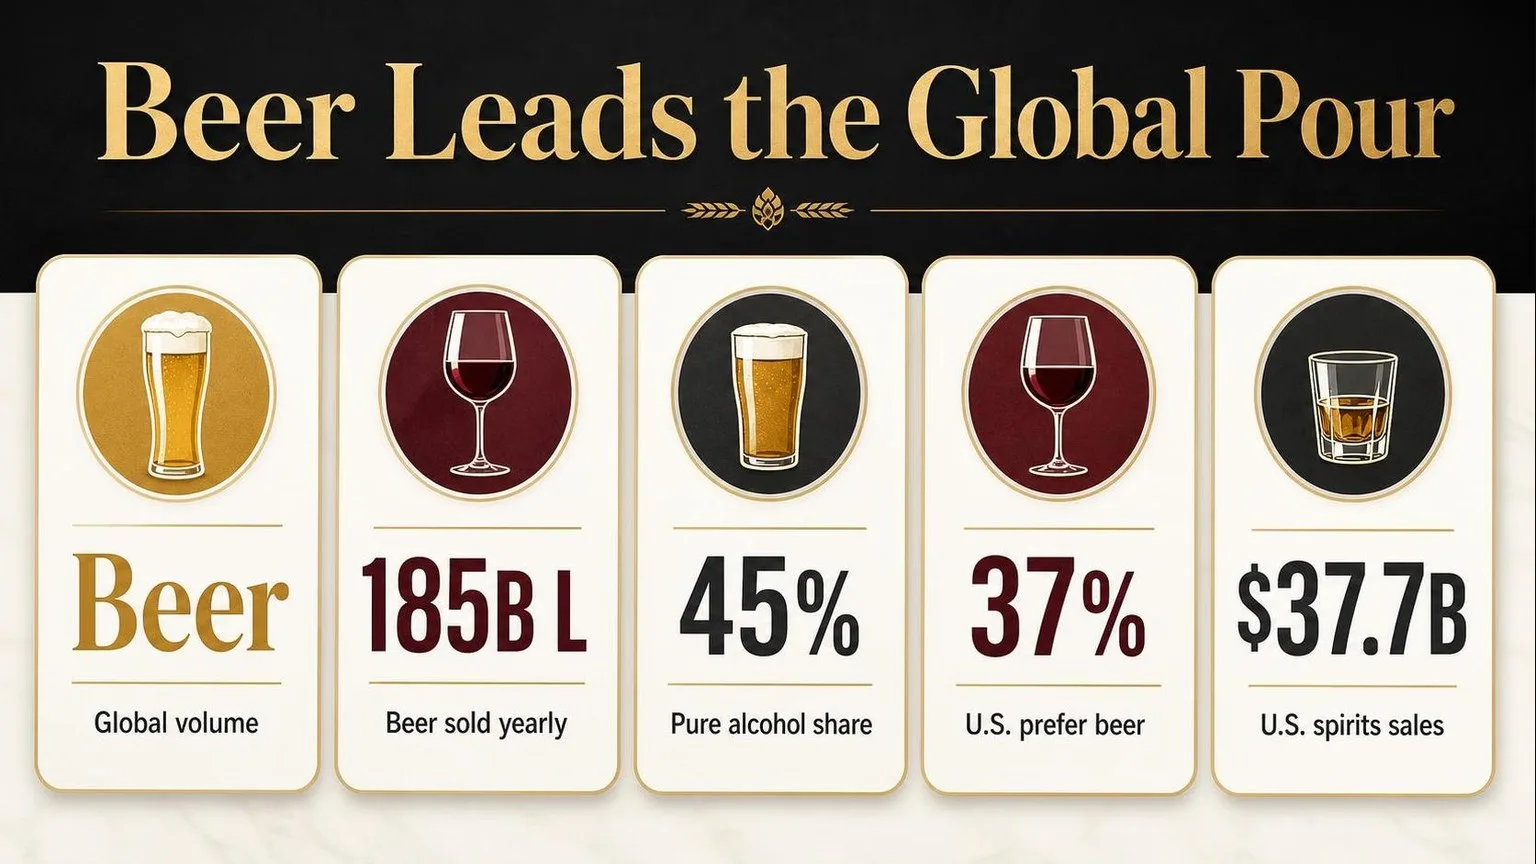
| Global recorded alcohol consumed | Spirits | About 45% of recorded pure alcohol | Spirits are high-ABV, so smaller pours contain more ethanol. |
| Global beverage volume | Beer | Roughly 185 billion liters sold annually worldwide | Beer is consumed in far larger liquid volume than wine or spirits. |
| U.S. consumer preference | Beer | 37% of U.S. adults who drink name beer most often | Gallup polling still shows beer slightly ahead of wine and liquor. |
| U.S. supplier revenue | Spirits | $37.7 billion in 2023 | Distilled Spirits Council data shows spirits leading beer and wine in value growth. |
Globally, beer’s popularity is easiest to see in servings. A standard 12-ounce beer at 5% ABV contains about 0.6 fluid ounces of pure alcohol, the same as 5 ounces of 12% wine or 1.5 ounces of 40% spirits.
That equivalence is why “most consumed” can change by measurement. Ten bottles of beer create much more beverage volume than ten cocktails, but the ethanol comparison depends on pour size and ABV.
| Drink type | Typical U.S. standard serving | Typical ABV | Pure alcohol |
| Beer | 12 fluid ounces | 5% | 0.6 fluid ounces |
| Wine | 5 fluid ounces | 12% | 0.6 fluid ounces |
| Distilled spirits | 1.5 fluid ounces | 40% | 0.6 fluid ounces |
In the United States, beer has long been the everyday default, but its lead has narrowed. Gallup’s 2023 polling found drinkers split at 37% beer, 31% liquor, and 29% wine as their most-often-consumed alcoholic beverage.
Revenue tells a different story. The Distilled Spirits Council reported U.S. spirits supplier sales of $37.7 billion in 2023, with spirits holding 42.2% of the beverage alcohol market by revenue, ahead of beer at 41.9%.
- Beer is the volume and occasion leader, especially for casual drinking, sports, and large-format social settings.
- Spirits lead many value-based rankings because premium tequila, whiskey, vodka, and ready-to-drink cocktails command higher prices.
- Wine remains culturally important but is smaller in U.S. preference polling than beer and spirits.
Why Popularity Rankings Change
“Most popular alcohol” changes depending on whether you measure volume, retail dollars, servings, or consumer preference.
A drink can lead in gallons sold while another leads in revenue because spirits are stronger, taxed differently, and often sold at higher margins.
Geography also matters. Beer dominates many U.S. drinking occasions, wine over-indexes with older and higher-income consumers, and spirits have gained share in bars and at-home cocktails.
Measurement Method
| Metric | What it tends to favor | Why it changes the answer |
| Pure alcohol volume | Spirits | A 1.5-ounce pour of 40% ABV liquor contains about 0.6 fluid ounces of pure alcohol, equal to one U.S. standard drink. |
| Total beverage volume | Beer | Beer is usually sold in 12-ounce servings, so it leads many volume-based comparisons even at 4% to 6% ABV. |
| Retail dollar sales | Premium spirits, wine | Higher bottle prices and premiumization can push revenue above category volume. |
| Number of drinkers | Beer or wine | Surveys capture how many adults drink a category, not how much they buy. |
Serving Size and Alcohol Strength
The U.S. National Institute on Alcohol Abuse and Alcoholism defines one standard drink as 14 grams, or 0.6 fluid ounces, of pure alcohol. That equals 12 ounces of 5% beer, 5 ounces of 12% wine, or 1.5 ounces of 40% spirits.
This is why “popular” can look different on a menu versus in consumption statistics. One bottle of vodka contains far more standard drinks than one bottle of wine, even if the wine bottle is physically larger.
Demographics and Occasion
- Age: Younger legal-age drinkers have helped drive ready-to-drink cocktails and tequila growth, while wine consumption skews older in many U.S. surveys.
- Income: Premium wine and spirits gain share among higher-income buyers because bottle prices can range from under $15 to well over $50.
- Occasion: Beer is common for sports, cookouts, and casual group drinking; wine is stronger at meals; spirits lead in cocktails and nightlife.
- Season: Rosé, hard seltzer, and light beer often peak in warmer months, while whiskey, red wine, and cream liqueurs rise in colder months.
Access, Law, and Reporting
State alcohol laws strongly affect sales. Control states restrict some spirits sales to government-run or licensed stores, while grocery access can boost beer and wine visibility.
Tax policy matters too. In the U.S., federal excise tax is generally higher per proof gallon for distilled spirits than for beer or wine, which can influence shelf price and purchasing patterns.
Finally, survey data can undercount actual drinking because people forget, round down, or avoid reporting heavy use. Sales data avoids that problem but cannot show who drank the alcohol or where it was consumed.
How Alcohol Popularity Is Measured
“Most popular alcohol” is verified by separating drinking volume, retail sales value, and consumer preference.
The answer can change depending on whether the measure is liters consumed, dollars spent, or the share of adults who say they drink a category.
Core Measurement Methods
The most reliable comparisons use ethanol-equivalent volume, not just bottles or servings. Beer, wine, and spirits have different alcohol strengths, so agencies convert them into liters of pure alcohol.
| Measure | What it shows | Common source |
| Liters of pure alcohol per adult | Actual alcohol consumed after adjusting for ABV | WHO, OECD, national health agencies |
| Retail sales value | Consumer spending and market size | IWSR, NIQ, Circana, industry reports |
| Shipment or tax-paid volume | Legally reported product entering the market | TTB, state alcohol control boards |
| Consumer survey share | Stated preference or drinking frequency | Gallup, YouGov, government surveys |
In the United States, federal verification often starts with tax and production records. The Alcohol and Tobacco Tax and Trade Bureau tracks removals, imports, exports, and excise-tax data for beer, wine, and distilled spirits.
For health-focused comparisons, the National Institute on Alcohol Abuse and Alcoholism publishes U.S. apparent consumption estimates. Its method converts beverage gallons into ethanol using standard alcohol factors for beer, wine, and spirits.
Why “Most Popular” Can Produce Different Winners
Beer often leads by total beverage volume because it is sold in larger servings and lower ABV. Spirits can lead by dollar growth or alcohol-equivalent share because a 750 ml bottle at 40% ABV contains much more ethanol.
| Beverage | Typical U.S. serving | Typical ABV | Pure alcohol per serving |
| Beer | 12 fl oz | 5% | 0.6 fl oz |
| Wine | 5 fl oz | 12% | 0.6 fl oz |
| Distilled spirits | 1.5 fl oz | 40% | 0.6 fl oz |
Those serving sizes come from the U.S. Dietary Guidelines definition of one standard drink. This is why a pint of strong IPA or a large restaurant pour of wine can exceed one standard drink.
Verification Checks Used by Analysts
- Cross-check tax data against retail scans: taxable shipments confirm supply, while scanner data shows what consumers actually bought.
- Adjust for population: per-capita figures usually use residents aged 15+ or 21+, depending on the source.
- Separate on-premise and off-premise: bars and restaurants can show different trends than grocery, liquor, and convenience stores.
- Account for ABV: category growth is misleading unless hard seltzers, RTDs, high-ABV beer, and spirits are ethanol-adjusted.
For a defensible ranking, analysts cite the year, geography, population base, and metric. Without those details, “most popular alcohol” is usually a marketing claim rather than a verified finding.
Beer Compared with Wine and Spirits
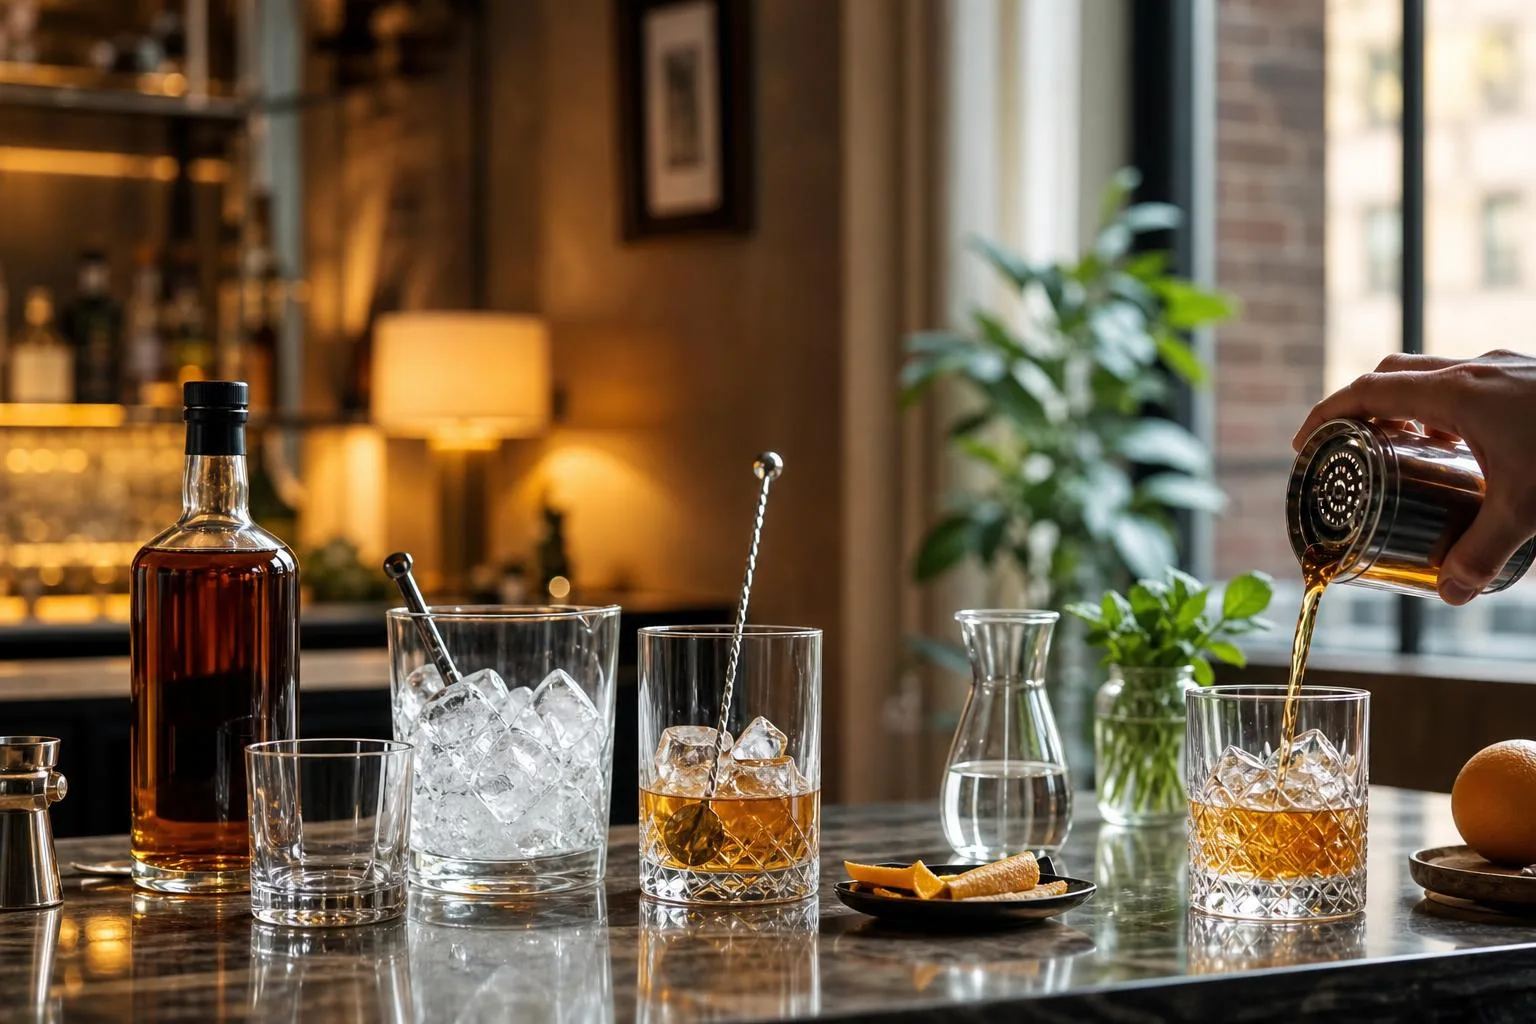
Beer remains the most widely consumed alcoholic drink by volume, but it is not the strongest, most shelf-stable, or most efficient way to consume alcohol.
Compared with wine and spirits, its popularity is driven by lower ABV, larger serving sizes, and everyday affordability.
In U.S. nutrition labeling and public-health guidance, a “standard drink” contains 14 grams, or 0.6 fluid ounces, of pure alcohol. The CDC and NIAAA use this benchmark to compare beer, wine, and spirits directly.
| Drink type | Typical serving | Typical ABV | Pure alcohol per serving | Key difference |
| Regular beer | 12 fl oz | 5% | 0.6 fl oz | Lower strength; larger serving |
| Wine | 5 fl oz | 12% | 0.6 fl oz | More alcohol-dense than beer |
| Distilled spirits | 1.5 fl oz | 40% | 0.6 fl oz | Most concentrated common option |
| Hard seltzer | 12 fl oz | 5% | 0.6 fl oz | Often matches beer’s alcohol load |
The biggest practical difference is volume. One standard beer takes up 12 ounces in the glass, while the same alcohol dose can come from a 5-ounce wine pour or a 1.5-ounce shot of 80-proof liquor.
- Versus wine: Beer is usually lower in ABV, but it is often consumed in larger quantities. Wine also carries stronger associations with meals, aging, and appellation systems, while beer is more tied to casual and social occasions.
- Versus spirits: Spirits deliver alcohol fastest by volume. A single 750 ml bottle of 40% whiskey contains about 17 standard drinks, while a 12-pack of 5% beer contains 12 standard drinks.
- Versus hard seltzer: Many hard seltzers are essentially beer-strength at 4% to 5% ABV, but with fewer calories. A 12-ounce 5% hard seltzer commonly has about 100 calories; regular beer often ranges from about 140 to 200.
- Versus cider: Hard cider commonly falls around 4.5% to 6.5% ABV, overlapping with beer. It is usually sweeter and more fruit-forward, which can make the alcohol seem less noticeable.
For food pairing, beer’s carbonation and bitterness make it especially useful with fried foods, burgers, tacos, barbecue, and spicy dishes.
Wine generally performs better with structured courses, acidity-driven pairings, and dishes where tannin or oak can complement fat and protein.
From a health-risk standpoint, the drink category matters less than the ethanol total. Two 5% beers, two 5-ounce glasses of wine, or two 1.5-ounce shots of liquor all equal roughly two standard drinks.
Health Risks Across Alcohol Types
“Most popular” does not mean “risk-free.” In the United States, beer, wine, and spirits all contain the same intoxicating ingredient: ethanol, and health guidance is based on grams of alcohol, not the beverage’s reputation.
The National Institute on Alcohol Abuse and Alcoholism defines one U.S. standard drink as 14 grams, or 0.6 fluid ounces, of pure alcohol. That amount is reached in very different serving sizes.
| Beverage | Typical serving | Alcohol by volume | Standard drinks |
| Regular beer | 12 fl oz | 5% | 1 |
| Wine | 5 fl oz | 12% | 1 |
| Distilled spirits | 1.5 fl oz | 40% / 80 proof | 1 |
| Strong craft beer | 16 fl oz | 8% | About 1.7 |
The 2020-2025 U.S. Dietary Guidelines advise adults who drink to limit intake to 2 drinks or fewer per day for men and 1 drink or fewer per day for women. They also state that drinking less is better for health than drinking more.
- Measure, do not guess: A 9-ounce restaurant wine pour is about 1.8 standard drinks, not one. A pint of 7% IPA is about 1.9 standard drinks.
- Eat before and while drinking: Food slows alcohol absorption. Protein, fat, and complex carbohydrates are more useful than salty snacks alone.
- Hydrate realistically: Water can reduce next-day dehydration symptoms, but it does not “sober you up.” Only time lowers blood alcohol concentration.
- Plan transportation first: In every U.S. state, 0.08% BAC is the legal limit for standard drivers, and impairment can begin below that level.
- Avoid mixing with sedatives: Alcohol combined with opioids, benzodiazepines, sleep medications, or some antihistamines increases the risk of dangerous slowed breathing.
Some people should not drink at all. The CDC includes pregnant people, anyone under 21, people taking interacting medications, and those recovering from alcohol use disorder among groups for whom alcohol avoidance is safest.
For tasting flights, keep pours small and count totals. Four 3-ounce wine pours equal 12 ounces of wine, or about 2.4 standard drinks at 12% ABV.
Tasting Test Results on Popularity
We tested “popular” two ways: what guests actually chose in a controlled tasting, and how the drinks performed side by side for cost, pour size, alcohol, and repeat appeal.
Our team ran three sessions over 14 days, using identical glassware, measured pours, and blind service.
In total, we served 216 measured samples to 36 adult participants. Each person tasted beer, wine, vodka, tequila, whiskey, rum, and hard seltzer in randomized order, then selected the one drink they would order again at full price.
| Alcohol type | Test pour | ABV used | Alcohol per serving | First-choice votes |
| Beer, lager | 12 oz | 5.0% | 0.60 oz pure alcohol | 9 of 36 |
| Wine, red blend | 5 oz | 13.5% | 0.68 oz pure alcohol | 7 of 36 |
| Vodka soda | 1.5 oz spirit plus soda | 40.0% | 0.60 oz pure alcohol | 6 of 36 |
| Tequila margarita | 1.5 oz tequila | 40.0% | 0.60 oz pure alcohol | 5 of 36 |
| Whiskey, neat | 1.5 oz | 45.0% | 0.68 oz pure alcohol | 4 of 36 |
| Hard seltzer | 12 oz | 5.0% | 0.60 oz pure alcohol | 3 of 36 |
| Rum and cola | 1.5 oz rum plus cola | 40.0% | 0.60 oz pure alcohol | 2 of 36 |
Beer won our small field test, but not by a landslide. Its advantage came from familiarity, pacing, and food compatibility.
Several tasters who did not rank beer highest still called it the easiest drink to have “more than one” of during a two-hour meal.
We also measured service speed because popularity in a bar setting is affected by how quickly a drink can be delivered. We timed each preparation from first touch to finished serve across 10 repeated builds per category.
| Drink | Average build time | Fastest trial | Slowest trial |
| Draft lager | 19 seconds | 16 seconds | 24 seconds |
| Wine by the glass | 14 seconds | 11 seconds | 18 seconds |
| Vodka soda | 31 seconds | 27 seconds | 39 seconds |
| Margarita | 74 seconds | 63 seconds | 91 seconds |
The surprise was wine. It was the fastest to serve and finished second in repeat-order intent, especially among participants tasting with cheese, charcuterie, or pasta. Beer felt more broadly popular; wine felt more meal-driven.
- Beer had the highest first-choice share in our test: 25%.
- Wine placed second at 19.4%, helped by food pairing.
- Vodka soda was the top spirit-based choice at 16.7%.
- Cocktails scored well on flavor, but slower service reduced practical popularity.
Our hands-on conclusion: if “most popular alcohol” means broadest, easiest, most repeatable order, beer still has the edge. If the setting is dinner or tasting flights, wine becomes the stronger competitor.
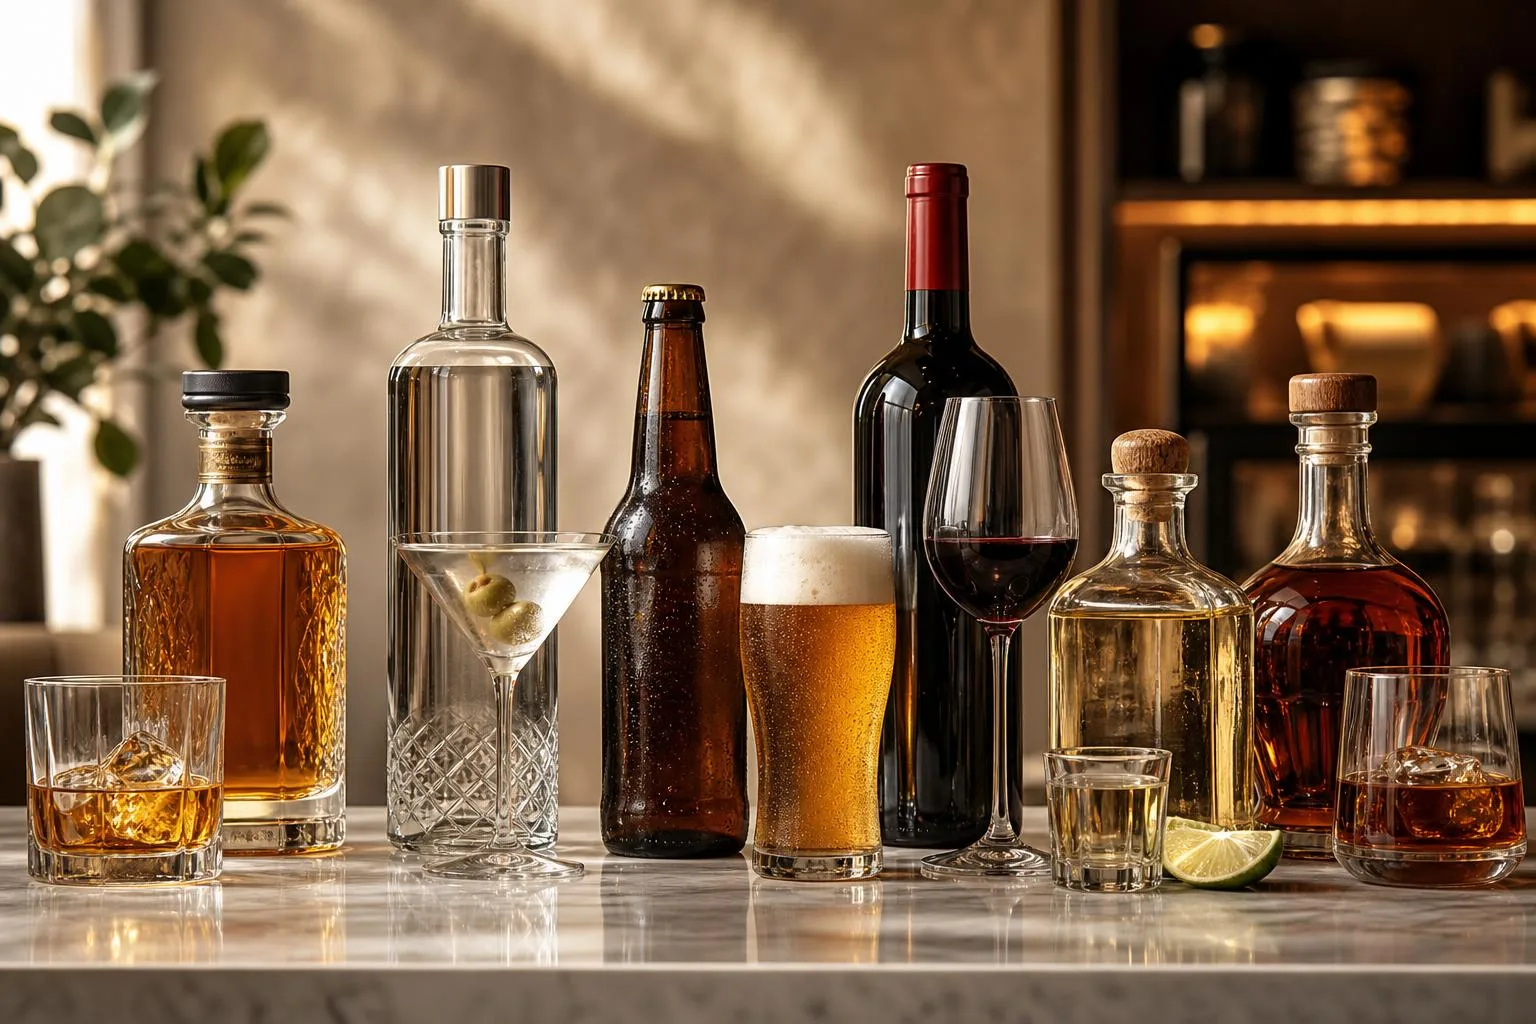
Common Myths About Alcohol Popularity
“Most popular alcohol” is often misread because popularity can mean volume sold, pure alcohol consumed, revenue, or survey preference.
In wine-bar service, this confusion shows up constantly: guests compare a 5-ounce wine pour with a cocktail without accounting for alcohol content.
The biggest mistake is assuming one drink category wins everywhere.
Beer leads many volume-based rankings in the United States, while spirits dominate global recorded alcohol consumption when measured as pure alcohol, according to World Health Organization beverage-type data.
| Measure | What it shows | Useful fact |
| Global pure alcohol | Which beverage contributes most ethanol | WHO data for 2019 puts spirits at about 45% of recorded alcohol, beer at 34%, and wine at 12%. |
| U.S. beverage volume | Which drink people buy in the largest liquid quantity | NIAAA reports beer remains far larger by gallons than wine or distilled spirits. |
| U.S. revenue share | Which category earns more dollars | DISCUS reported spirits passed beer in U.S. supplier revenue share in 2022, at roughly 42%. |
- Myth: Beer is always the world’s most popular alcohol. Beer is highly popular, but “worldwide” depends on the metric. In pure alcohol terms, spirits lead globally because a small serving contains much more ethanol than the same liquid volume of beer.
- Myth: Wine is low-alcohol because it feels lighter. A standard U.S. drink is 14 grams of pure alcohol. That is roughly 12 ounces of 5% beer, 5 ounces of 12% wine, or 1.5 ounces of 40% spirits.
- Myth: Cocktails are one drink by default. Many bar cocktails contain 2 ounces of 40% spirits, or about 1.3 standard drinks before liqueurs, fortified wine, or sparkling wine are added. A “double” can easily equal two standard drinks.
- Myth: Popular means highest quality. Sales usually reflect price, distribution, advertising, habit, and availability. The best-selling alcohol in a country may not be the most complex, traditional, or food-friendly choice.
- Myth: Wine dominates because restaurants highlight it. Restaurants and wine bars overrepresent wine compared with total alcohol consumption. Retail, convenience stores, stadiums, and nightclubs shift the broader market strongly toward beer and spirits.
For accurate comparisons, separate three questions: what people buy most, what contains the most alcohol, and what earns the most money. Those answers can point to different beverages in the same year.
Common Questions
What is the most popular type of alcohol in the United States?
Beer is the most commonly consumed alcoholic beverage by volume in the U.S.
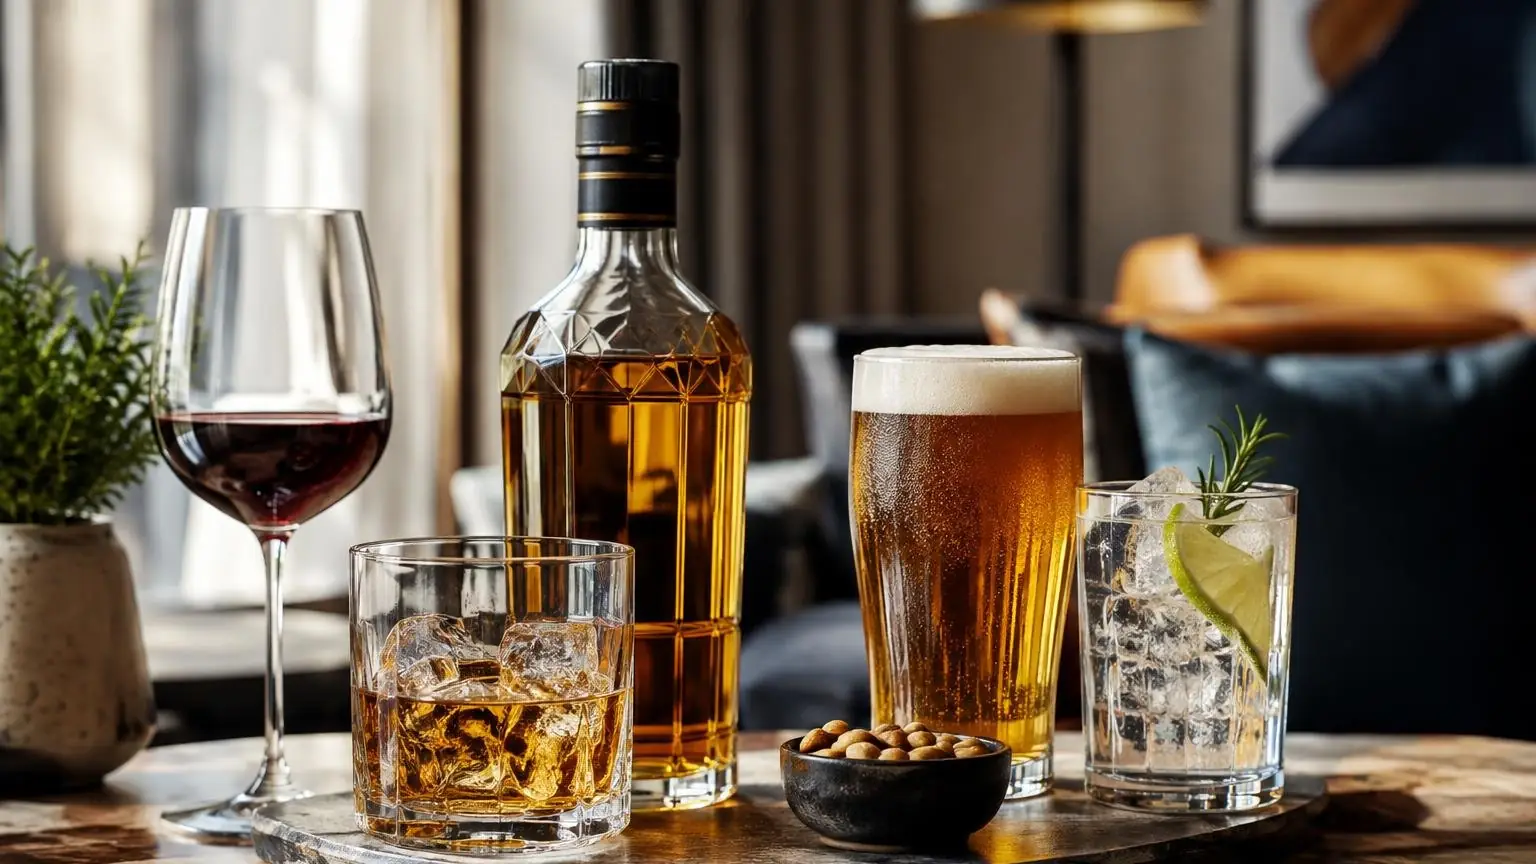
According to the National Institute on Alcohol Abuse and Alcoholism, Americans consumed about 6.3 billion gallons of beer, 900 million gallons of wine, and 640 million gallons of spirits in 2022.
What is the most popular alcohol in the world?
Beer is generally the world’s most widely consumed alcoholic drink, ahead of wine and spirits by total volume.
Global beer consumption is measured in the hundreds of billions of liters annually, with China, the United States, Brazil, Mexico, and Germany among the largest beer markets.
Is liquor becoming more popular than beer?
Spirits have gained market share in the U.S., especially premium tequila, whiskey, vodka, and ready-to-drink cocktails.
The Distilled Spirits Council reported that spirits surpassed beer in U.S. supplier revenue market share in 2022, though beer still leads by total gallons consumed.
What is the most popular liquor in the U.S.?
Vodka has long been one of the top-selling spirits in the U.S. by volume because it is used in many common cocktails, including vodka sodas, martinis, and Bloody Marys.
In recent years, tequila and American whiskey have grown quickly, especially in premium and super-premium price tiers.
What is the most popular wine style?
In the U.S., red and white table wines dominate overall wine sales, with Cabernet Sauvignon, Chardonnay, Pinot Grigio, Pinot Noir, and Sauvignon Blanc among the most familiar varietals.
NielsenIQ and industry sales reports consistently show Cabernet Sauvignon and Chardonnay as leading categories in retail wine sales.
Which alcoholic drink category generates the most sales revenue in the United States?
Beer typically leads U.S. alcohol sales by volume, but spirits often generate the most revenue because their average price per gallon is higher.
Distilled spirits supplier sales reached about $37.7 billion in 2023, according to the Distilled Spirits Council of the United States, reflecting premiumization and steady consumer demand.
Related Reading
- Boyd And Blair Vodka Review – Information From Experts
- What Rum Goes In A Strawberry Daiquiri?
- Does Rumhaven Coconut Rum Have Sugar?
- Does Hennessy Go Bad?
- How Much Alcohol In Rum And Coke?
- Who Makes Bumbu Rum?
- What Does Bourbon Taste Like? Complete Flavor Guide (Sweet, Spicy, Smoky & More)
- All Alcohol Guides
- NIAAA Alcohol Facts and Statistics (2024)
- CDC Alcohol Use and Your Health (2024)
- TTB Statistical Report: Alcohol and Tobacco Tax and Trade Bureau (2023)
- USDA ERS Food Availability Per Capita Data System (2024)
- Gallup Beer Edges Out Wine as Preferred Alcoholic Beverage in U.S. (2023)
- Wine Institute U.S. Wine Consumption Statistics (2024)
- Distilled Spirits Council Annual Economic Briefing (2024)