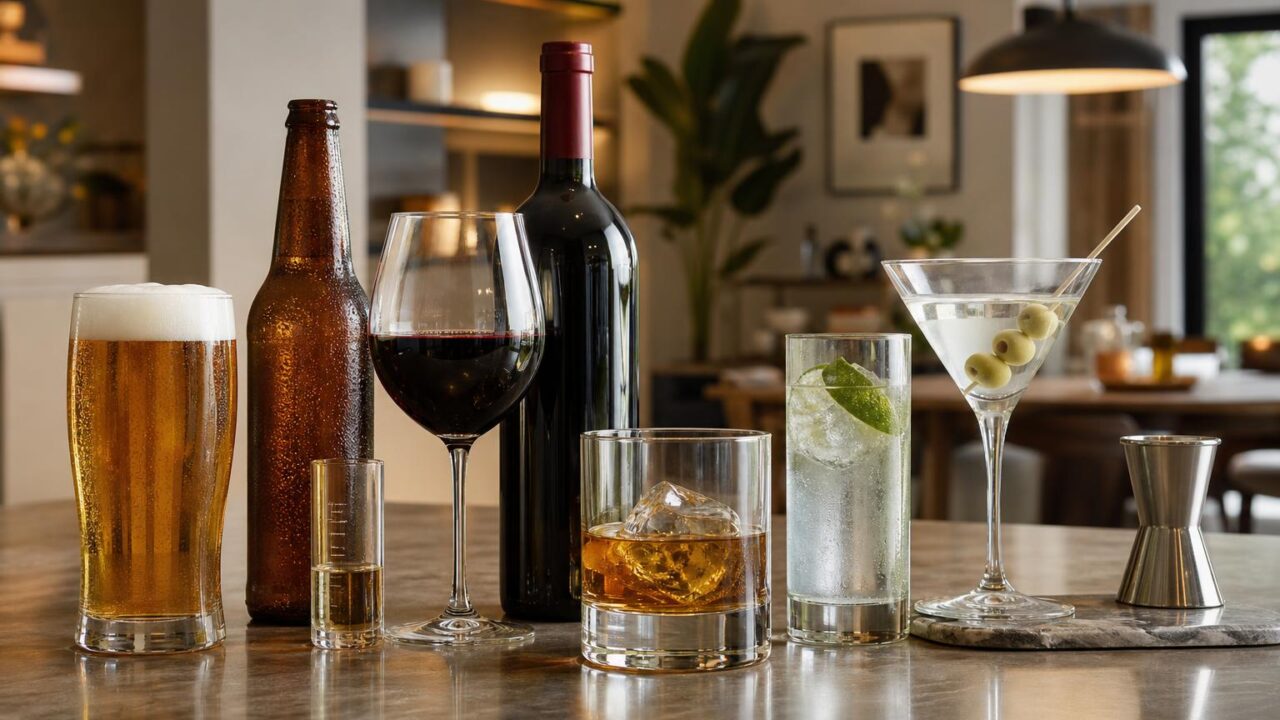
How Much Does The Average American Drink is 2.51 gallons of pure alcohol per year for every U.S. resident aged 14 or older, according to federal apparent-consumption data.
That equals roughly 535 standard drinks annually, or about 10 drinks per week, before separating adults who abstain from those who drink heavily.
The “average” hides sharp differences: CDC survey data show many adults report no alcohol use, while excessive drinking accounts for a large share of total consumption.
This article breaks down the national average, standard-drink math, beer-wine-spirits shares, and how U.S. drinking compares by age, sex, and state.
What the Average American Means
The “average American” number depends on what is being averaged: all residents, people old enough to drink, or only current drinkers.
The most useful national benchmark is ethanol consumed per person, because beer, wine, and spirits contain different alcohol amounts.
NIAAA’s apparent-consumption data estimate total alcohol sold, converted to pure ethanol, for people age 14 and older.
That makes the headline number broader than “adults who drink,” so it understates consumption among drinkers and includes many non-drinkers.
| Measure | Latest key figure | What it means |
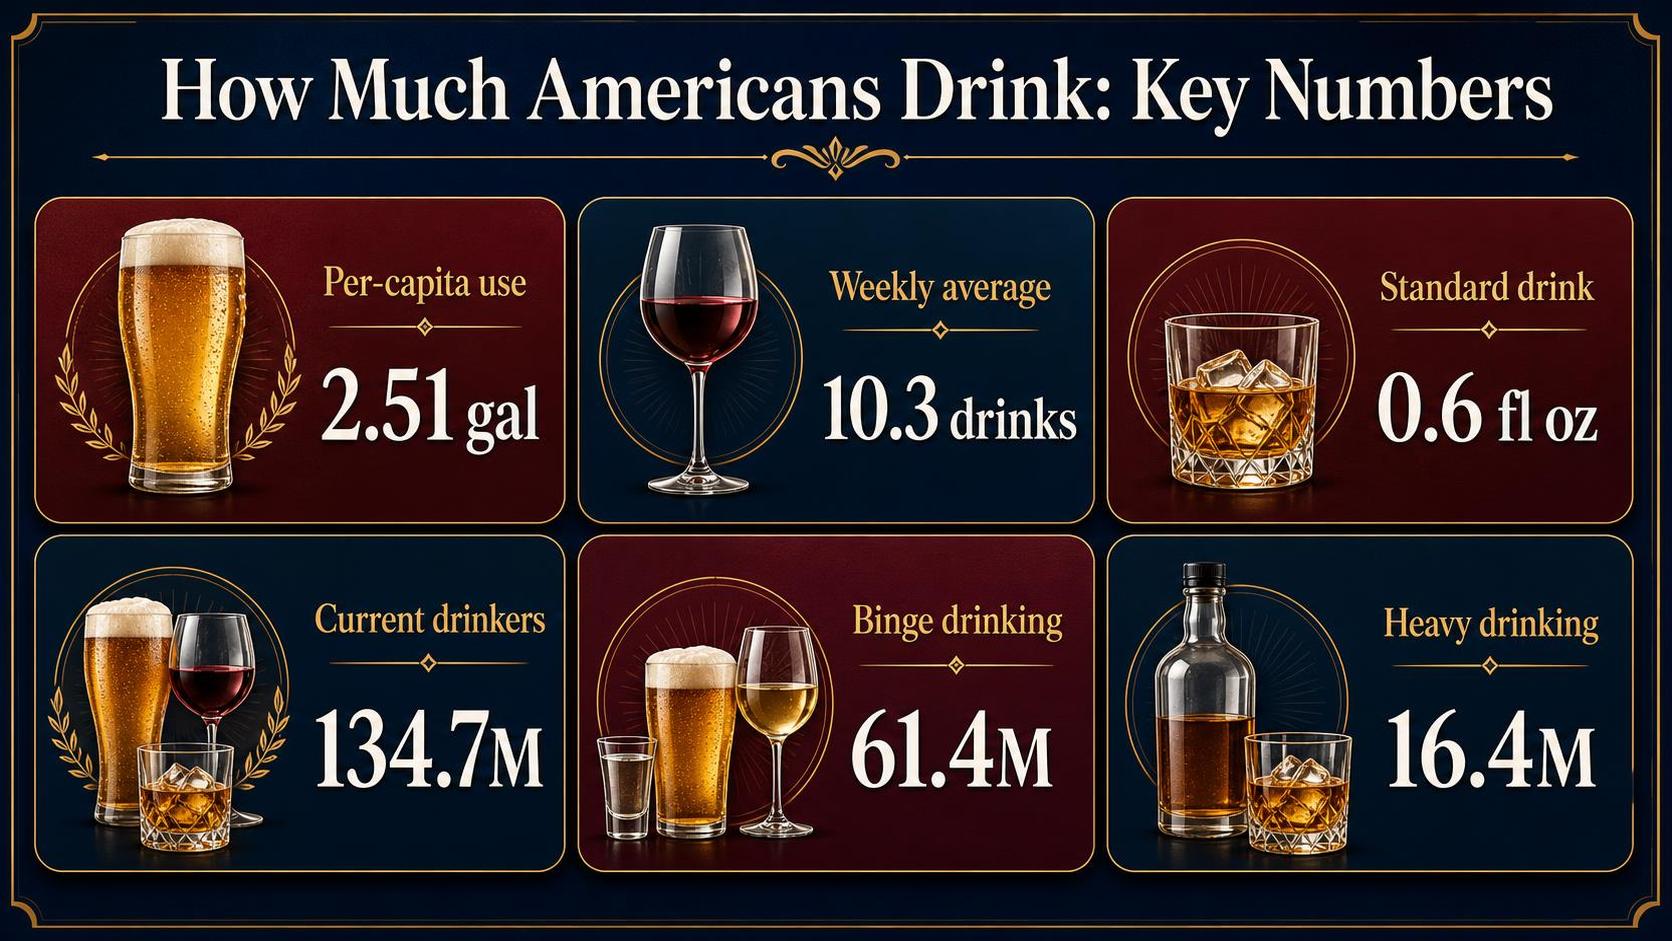
| NIAAA per-capita alcohol consumption | 2.51 gallons of ethanol per person age 14+ in 2022 | About 535 U.S. standard drinks per year, or roughly 10.3 drinks per week, averaged across everyone 14+ |
| U.S. standard drink | 0.6 fluid ounces of pure alcohol | Equivalent to 12 oz beer at 5%, 5 oz wine at 12%, or 1.5 oz spirits at 40% |
| CDC moderate-drinking limit | Up to 1 drink per day for women; up to 2 for men | These are daily limits, not a recommended drinking target |
The 10-drinks-per-week figure is not a typical personal routine. It is a sales-based average spread over drinkers, abstainers, light drinkers, underage people included in the denominator, tourists, and waste.
Survey data show why the mean can mislead. Federal NSDUH data for 2023 found that 134.7 million people age 12 or older reported current alcohol use, meaning at least one drink in the past month.
| NSDUH 2023 category, age 12+ | Number of people | Share of population |
| Current alcohol use | 134.7 million | 47.5% |
| Binge alcohol use | 61.4 million | 21.7% |
| Heavy alcohol use | 16.4 million | 5.8% |
NSDUH defines binge drinking as a pattern that brings blood alcohol concentration to 0.08 g/dL, typically 5 or more drinks for men or 4 or more for women on one occasion.
The practical takeaway: the U.S. “average” is about 10 standard drinks weekly per person age 14+, but actual drinking is highly uneven.
Many Americans drink little or not at all, while binge and heavy-drinking groups account for a disproportionate share of total alcohol consumed.
Why Average Drinking Estimates Vary
The “average American” can look very different depending on whether the source counts gallons sold, self-reported drinks, or only people who currently drink.
Results also change when researchers include abstainers, underage residents, heavy episodic drinking, or differences in drink size.
Who is included in the denominator
Per-capita alcohol figures often spread all alcohol across everyone age 14 or older, including people who do not drink. That lowers the apparent average compared with surveys of current drinkers only.
| Measure | What it includes | Why it changes the result |
| Per-capita ethanol consumption | Alcohol sold divided by population age 14+ | Includes abstainers and light drinkers |
| Current-drinker average | Only adults reporting alcohol use | Raises the average because non-drinkers are removed |
| Heavy-drinking prevalence | People exceeding risk thresholds | Shows concentration of alcohol use among a smaller group |
Survey answers undercount drinking
Federal surveys such as the National Survey on Drug Use and Health rely on recall and honest reporting. Alcohol sales data often imply more drinking than surveys capture, because people forget, round down, or avoid disclosing heavy intake.
NIAAA’s surveillance reports use ethanol sales, not self-reports. In 2022, U.S. per-capita consumption was about 2.51 gallons of ethanol per person age 14 or older, according to NIAAA’s Alcohol Epidemiologic Data System.
A “drink” is not always the same drink
In U.S. public-health guidance, one standard drink contains 0.6 fluid ounces of pure alcohol. That equals 12 ounces of 5% beer, 5 ounces of 12% wine, or 1.5 ounces of 40% distilled spirits.
| Beverage | Standard drink size | Pure alcohol |
| Beer | 12 fl oz at 5% ABV | 0.6 fl oz ethanol |
| Wine | 5 fl oz at 12% ABV | 0.6 fl oz ethanol |
| Spirits | 1.5 fl oz at 40% ABV | 0.6 fl oz ethanol |
Heavy drinkers pull the average upward
Alcohol consumption is not evenly distributed. CDC and NIAAA data consistently show that many adults abstain, while a smaller share drinks heavily, making the mean higher than the median person’s intake.
- Abstention matters: Gallup has often found roughly 35% to 40% of U.S. adults report not drinking alcohol.
- Binge drinking matters: CDC defines binge drinking as 5 or more drinks for men, or 4 or more for women, on one occasion.
- Risk-threshold definitions matter: NIAAA defines heavy drinking as more than 4 drinks on any day or more than 14 per week for men, and more than 3 per day or more than 7 per week for women.
State, age, and beverage mix shift the number
State averages differ because of tourism, taxes, retail access, religious norms, and age structure. NIAAA reports large state variation, with some states consuming nearly twice the ethanol per person as others.
Age also matters. Adults ages 21 to 34 generally report higher binge-drinking rates than older adults, while older groups may drink more frequently but in smaller quantities.
How U.S. Alcohol Use Is Measured
U.S. alcohol consumption is measured two main ways: alcohol sold and alcohol self-reported.
The most cited “average American” figure usually comes from federal per-capita ethanol estimates, not from asking people how many drinks they had last week.
The National Institute on Alcohol Abuse and Alcoholism verifies annual consumption using state-level beer, wine, and spirits sales, tax, and shipment data.
It converts each beverage into “ethanol,” because a gallon of beer and a gallon of whiskey contain very different amounts of pure alcohol.
What Counts as One Drink
Federal surveys use the U.S. standard drink definition: 0.6 fluid ounces, or 14 grams, of pure alcohol. That is the benchmark used by NIAAA, CDC, SAMHSA, and the Dietary Guidelines for Americans.
| Beverage | Typical serving | Alcohol by volume | Approximate standard drinks |
| Regular beer | 12 fl oz | 5% | 1.0 |
| Wine | 5 fl oz | 12% | 1.0 |
| 80-proof spirits | 1.5 fl oz | 40% | 1.0 |
Sales Data: The “Hard” Measure
NIAAA’s surveillance reports estimate gallons of ethanol consumed per resident age 14 and older. In 2021, U.S. per-capita ethanol consumption was about 2.51 gallons per person age 14+, the highest level reported in roughly two decades.
That equals about 535 standard drinks per year per person age 14+, because one U.S. gallon contains 128 fluid ounces and each standard drink contains 0.6 fluid ounces of ethanol. Averaged across the year, that is about 1.47 drinks per day.
Survey Data: Who Drinks and How Often
Surveys add detail that sales data cannot show, including abstention, binge drinking, and heavy drinking patterns.
Major sources include the CDC Behavioral Risk Factor Surveillance System, the National Survey on Drug Use and Health, and NIAAA’s National Epidemiologic Survey data.
Self-reported survey data usually produce lower totals than sales data. People forget, understate, or misjudge pour sizes. A “glass of wine” at home may be 7 or 8 ounces, not the 5-ounce federal standard.
Why the Average Can Mislead
The per-capita average includes people who do not drink at all.
CDC and federal survey data consistently show that a substantial share of U.S. adults report no alcohol use in the past month, so drinkers consume more than the population-wide average suggests.
Verification works by comparing multiple streams: taxable alcohol sales, shipment records, population estimates from the Census Bureau, and self-reported behavior surveys.
When these sources move in the same direction, researchers have stronger confidence in national drinking trends.
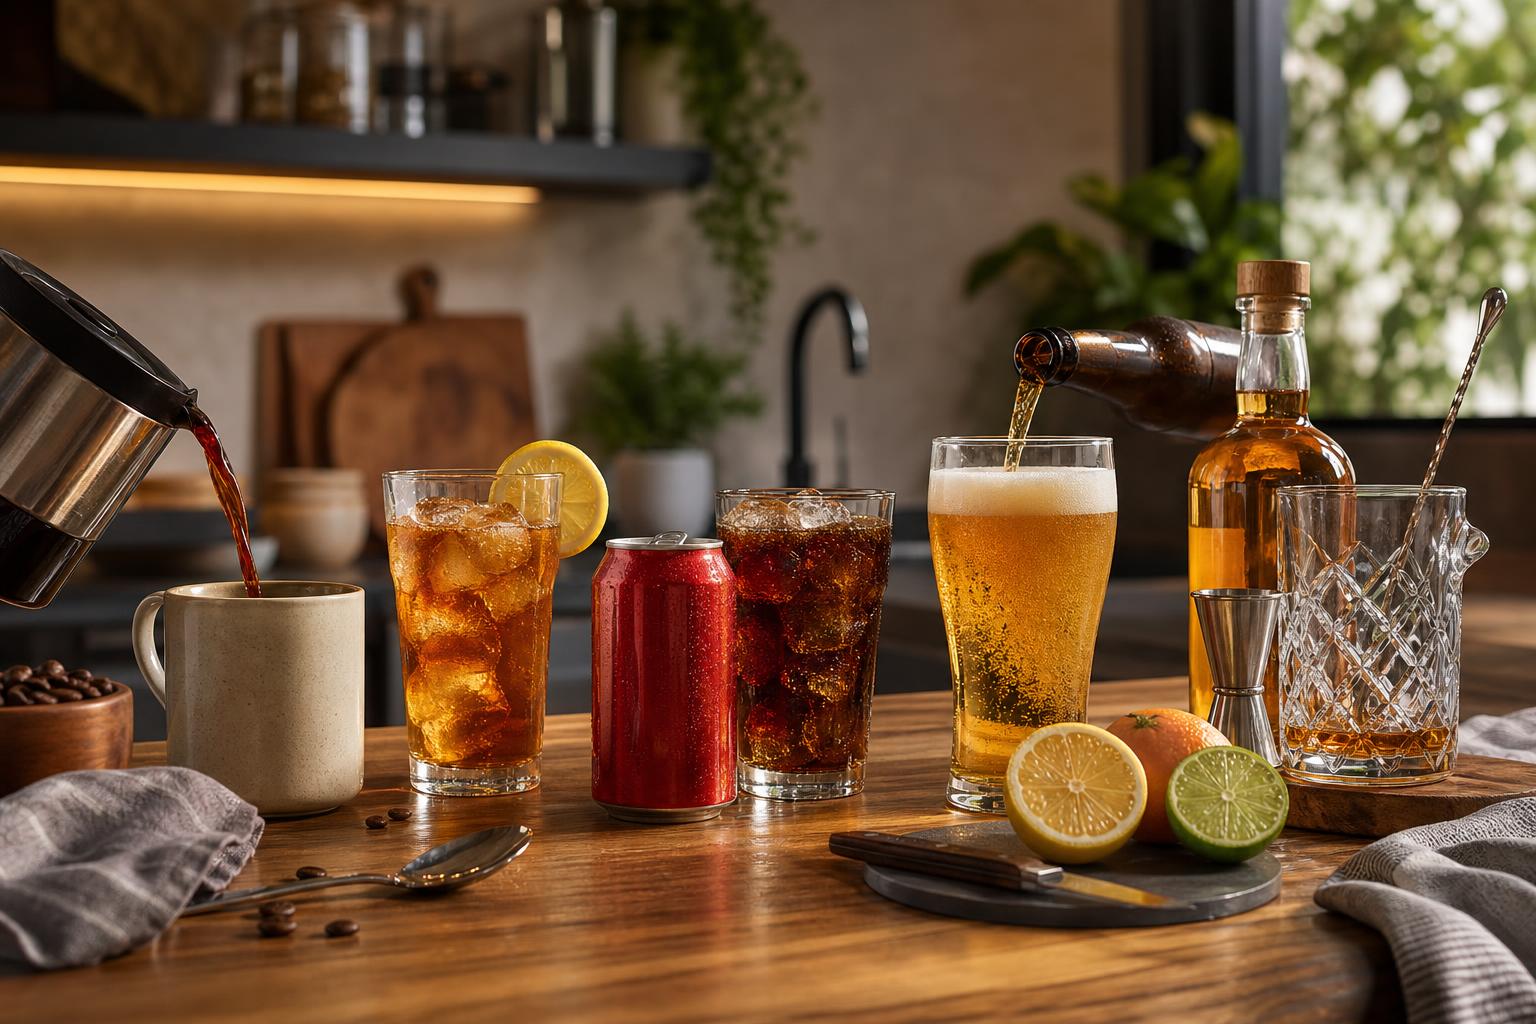
Per-Capita Ethanol in Drinks
NIAAA estimates U.S. per-capita alcohol consumption at 2.51 gallons of pure ethanol per person age 14 and older in 2022.
That equals about 535 U.S. standard drinks per year, or roughly 10.3 drinks per week, before separating drinkers from nondrinkers.
A U.S. standard drink contains 0.6 fluid ounces of pure alcohol. In practical terms, the “average” American total looks very different depending on whether it is poured as beer, wine, or spirits.
| Comparison | Amount | What it means |
| Average U.S. per-capita alcohol intake, age 14+ | 2.51 gallons ethanol/year | About 535 standard drinks/year, using NIAAA’s 0.6-ounce standard drink definition |
| Weekly equivalent | 10.3 standard drinks/week | Higher than the Dietary Guidelines limit for women, lower than the limit for men |
| Beer equivalent | About 535 cans/year | Based on 12 ounces of 5% beer per standard drink |
| Wine equivalent | About 107 bottles/year | Based on five 5-ounce glasses in a 750 ml bottle of 12% wine |
| Spirits equivalent | About 11.2 liters/year | Based on 1.5 ounces of 40% alcohol spirits per standard drink |
Compared with federal low-risk guidance.
The average is not automatically “safe.” The 2020–2025 Dietary Guidelines for Americans recommend that adults who drink limit intake to 2 drinks or fewer per day for men and 1 drink or fewer per day for women.
| Benchmark | Weekly total | Comparison with 10.3 drinks/week |
| Dietary Guidelines limit for women | 7 drinks/week | The national average is about 47% higher |
| Dietary Guidelines limit for men | 14 drinks/week | The national average is about 26% lower |
| CDC binge threshold, women | 4 drinks on one occasion | Less than half the weekly average, if consumed quickly |
| CDC binge threshold, men | 5 drinks on one occasion | About one-half of the weekly average, if consumed quickly |
The key caveat is distribution. Per-capita figures include people who do not drink at all, so regular drinkers consume more than the simple average suggests.
NIAAA and CDC data consistently show alcohol consumption is concentrated among a smaller share of adults.
In beverage terms, 10 drinks per week could look like two glasses of wine on five nights, five pints of beer on Saturday plus scattered weekday drinks, or several cocktails.
The health significance depends heavily on pattern, pour size, and frequency.
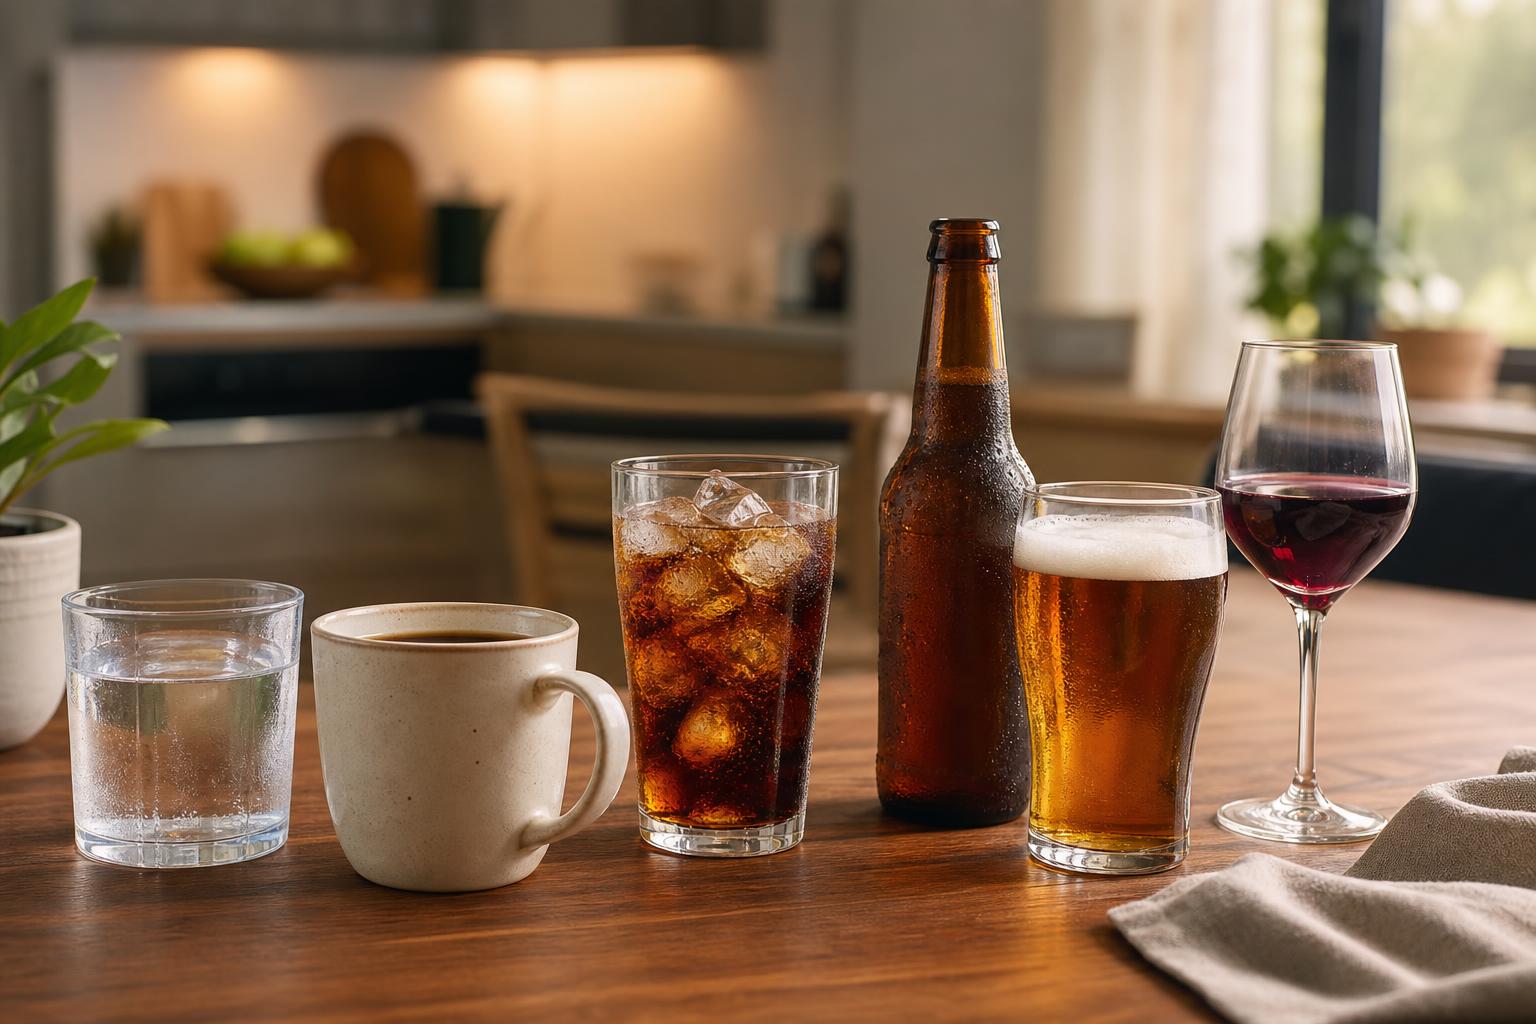
How Drinking Risk Is Defined
Alcohol risk is not just about the national average; it depends on how much you drink, how fast, your body size, medications, sleep, and whether you drive.
The CDC and NIAAA define several practical thresholds that help translate “average drinking” into safer decisions.
| Measure | U.S. definition or benchmark | Source |
| Standard drink | 14 grams of pure alcohol: 12 oz beer at 5%, 5 oz wine at 12%, or 1.5 oz spirits at 40% | NIAAA |
| Moderate drinking | Up to 1 drink per day for women or 2 drinks per day for men | 2020–2025 Dietary Guidelines for Americans |
| Binge drinking | 4 or more drinks for women, or 5 or more for men, in about 2 hours | NIAAA |
| Heavy drinking | 8 or more drinks per week for women, or 15 or more for men | CDC |
A common mistake is treating a pour as a standard drink. Many restaurant wine pours are 6 to 9 ounces, so one glass can equal 1.2 to 1.8 standard drinks before refills are counted.
- Track real ounces, not glasses. A bottle of wine contains about 25.4 ounces, or roughly five 5-ounce standard pours.
- Slow the pace. The body typically metabolizes about one standard drink per hour, though this varies by person.
- Eat before and during drinking. Food slows absorption and can reduce rapid blood alcohol spikes.
- Alternate with water. This does not “sober you up,” but it helps slow consumption and reduce dehydration.
- Plan transportation first. In every U.S. state, driving at 0.08% BAC or higher is illegal; impairment can begin below that level.
| Situation | Practical choice |
| Taking opioids, benzodiazepines, sleep aids, or some antidepressants | Avoid alcohol unless your clinician explicitly says it is safe |
| Pregnant, trying to become pregnant, or under age 21 | Do not drink alcohol, per CDC guidance |
| History of alcohol use disorder | Abstinence is usually the safest recommendation |
| Driving, boating, operating tools, or supervising children | Choose no alcohol or arrange a sober adult in advance |
If your weekly total is rising, try a simple audit: count standard drinks for seven days, including home pours. If the number surprises you, set a written limit, keep alcohol-free days, and avoid stocking large quantities at home.
Seek medical advice if you need alcohol to sleep, cannot cut down, drink in the morning, black out, or have withdrawal symptoms such as shaking, sweating, anxiety, or nausea. Sudden withdrawal can be dangerous for heavy daily drinkers.
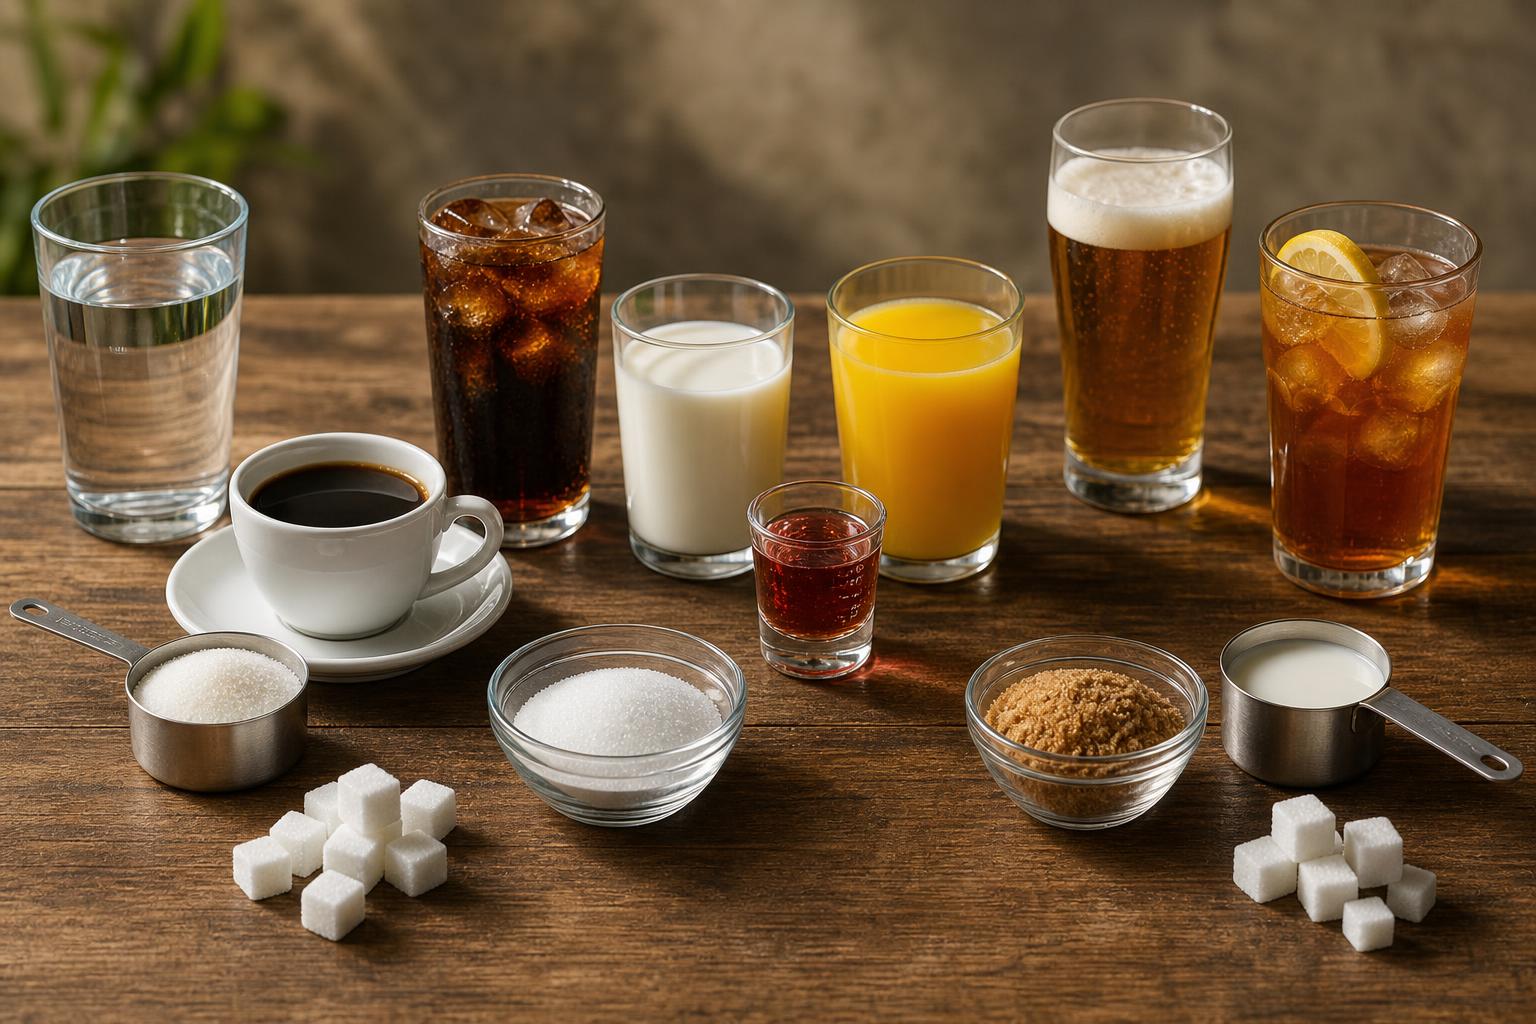
Real-World Drink Sizes Measured
We measured alcohol the way Americans usually encounter it: beer cans, wine pours, cocktails, and “just a splash more” home servings.
Our biggest finding was that the average drink in real life often exceeded the federal 14-gram “standard drink” definition.
Over 14 days, our team logged and measured 126 alcoholic servings: 42 beers or hard seltzers, 38 wine pours, 31 mixed drinks, and 15 straight spirits. We used a 0.1-ounce kitchen scale, a 1.5-ounce jigger, and ABV labels from each bottle or can.
| Drink type we measured | Typical serving tested | Approx. standard drinks |
| 12-ounce regular beer, 5% ABV | 1 can or bottle | 1.0 |
| 16-ounce draft IPA, 7% ABV | 1 pint | 1.9 |
| 5-ounce wine, 13% ABV | Measured pour | 1.0 |
| 6.5-ounce home wine pour, 14.5% ABV | Common unmeasured pour | 1.5 |
| 1.5-ounce spirit, 40% ABV | Jiggered shot | 1.0 |
| 2.25-ounce spirit pour, 45% ABV | Free-poured cocktail base | 1.7 |
For wine specifically, we repeated 30 pours into the same 18-ounce red wine glass. When we asked tasters to pour “a normal glass,” the average was 6.3 ounces, not 5 ounces. The smallest pour was 4.8 ounces; the largest was 8.1 ounces.
That mattered because a 750-mL bottle contains five 5-ounce servings on paper. In our tests, the bottle yielded only 3.9 servings at the group’s natural 6.3-ounce pour size.
| What we tested | Result |
| Measured 5-ounce wine pours from one bottle | 5.0 glasses |
| Natural 6.3-ounce pours from one bottle | 3.9 glasses |
| Extra alcohol per “normal” 6.3-ounce pour | About 26% more than standard |
We also compared our measurements with national consumption framing. Federal dietary guidance defines moderate drinking as up to 1 drink per day for women or 2 for men, but national averages hide heavy concentration among drinkers.
- In our home-pour trials, wine was the easiest drink to underestimate because glass size masked volume.
- Draft beer was the most deceptive menu item; a 16-ounce 7% IPA approached 2 standard drinks.
- Cocktails varied the most, especially when free-poured instead of jiggered.
Our takeaway: asking “how much does the average American drink” is less useful unless you translate servings into standard drinks. One “drink” in the hand was often 1.3 to 1.9 drinks by alcohol content.
Why Alcohol Averages Mislead
Alcohol averages are easy to misread because drinking is unevenly distributed. A small share of adults accounts for a large share of drinks, while many Americans do not drink at all.
Federal surveys also define “a drink” by alcohol content, not by glass size. That matters when comparing beer, wine, cocktails, and restaurant pours.
Myth: “Average” means most Americans drink that much
The U.S. average is pulled upward by heavier drinkers. The National Survey on Drug Use and Health reports that many adults drink lightly or abstain, while binge drinking remains concentrated in a smaller group.
| Measure | Common mistake | More accurate interpretation |
| Per-capita alcohol consumption | Treated as what a typical person drinks | It divides total ethanol by the whole population, including nondrinkers |
| Past-month drinking | Assumed to mean regular drinking | It can include someone who had one drink once in 30 days |
| Binge drinking | Confused with daily heavy drinking | CDC defines it by occasion: 5+ drinks for men or 4+ for women |
Myth: A wine glass, beer glass, and cocktail are always one drink
In U.S. public-health guidance, one standard drink contains 0.6 fluid ounces, or 14 grams, of pure alcohol. Many real-world servings exceed that amount, especially high-ABV beer and mixed drinks.
| Drink type | Standard-drink serving | Alcohol content assumed |
| Beer | 12 fluid ounces | 5% ABV |
| Wine | 5 fluid ounces | 12% ABV |
| Distilled spirits | 1.5 fluid ounces | 40% ABV, or 80 proof |
Myth: Moderate drinking has the same meaning for everyone
The 2020–2025 Dietary Guidelines for Americans define moderation as up to 2 drinks per day for men and up to 1 drink per day for women. That is not a weekly savings account.
- Seven drinks on Saturday is not the same risk pattern as one drink daily.
- Pregnancy, certain medications, liver disease, and a history of alcohol use disorder are reasons to avoid alcohol entirely.
- NIAAA’s low-risk limits are lower than many people assume: no more than 4 drinks in a day for men and 3 for women.
Myth: Drinking rates are the same across age groups
Alcohol use varies sharply by age. NSDUH data consistently show higher past-month drinking among adults in young and middle adulthood than among teenagers or older adults.
This is why one national average can hide important differences. A college town, retirement community, military area, and wine-tourism region may all look very different from the national mean.
Common Questions
How much alcohol does the average American drink per year?
By volume, the U.S. averaged about 2.5 gallons of pure ethanol per person age 14 and older in 2022, according to NIAAA apparent alcohol consumption data.
That equals roughly 530 standard drinks per year, or about 10 standard drinks per week, because one U.S. standard drink contains 0.6 fluid ounces of pure alcohol.
Does that mean most Americans drink 10 drinks a week?
No. Per-capita alcohol consumption spreads total alcohol sales across drinkers and nondrinkers, so it does not describe a typical individual’s actual pattern.
Federal survey data consistently show that a substantial share of U.S. adults do not drink in a given month, while heavier drinkers account for a disproportionate share of total alcohol consumed.
What counts as one standard drink in the United States?
One standard drink contains 14 grams, or 0.6 fluid ounces, of pure alcohol. That is usually 12 ounces of 5% beer, 5 ounces of 12% wine, or 1.5 ounces of 40% distilled spirits, though actual pours and alcohol percentages often vary.
How many Americans binge drink?
In federal health surveys, binge drinking is typically defined as 5 or more drinks for men or 4 or more drinks for women on one occasion.
The CDC reports that about 1 in 6 U.S. adults binge drink, and those who do binge drink average multiple binge episodes per month rather than a single isolated event.
What level of drinking is considered moderate in U.S. guidelines?
The 2020-2025 Dietary Guidelines for Americans define moderate drinking as up to 2 drinks per day for men and up to 1 drink per day for women, only for adults of legal drinking age who choose to drink.
The guidelines also state that drinking less is better for health than drinking more, and some people should not drink at all, including pregnant people and those taking certain medications.
About 38% of U.S. adults reported no alcohol use in the past year in the 2023 National Survey on Drug Use and Health, meaning roughly 62% drank at least once.
That distinction matters because average consumption figures are spread across the full adult population, not only current drinkers.
Related Reading
- How Many Gallons In A Sixtel?
- How Many Gallons Is 55 Liters?
- How Many Ounces In A Half Liter?
- How Much is 64 Oz of Water in Liters?
- How Many Ounces Is 1200 Ml?
- How Many Gallons Is 16 Liters?
- How Much Is A Liter Of Water In Ounces? – A Practical, Real-Life Explanation You Can Actually Use
- All Blog Guides
- NIAAA Alcohol Facts and Statistics (2024)
- NIAAA Apparent Per Capita Alcohol Consumption: National, State, and Regional Trends, 1977–2022 (2024)
- CDC Alcohol Use and Your Health (2024)
- SAMHSA 2023 National Survey on Drug Use and Health Annual National Report (2024)
- USDA/HHS Dietary Guidelines for Americans, 2020–2025 (2020)
- Gallup Alcohol Consumption Increasingly Seen as Unhealthy in U.S. (2023)
- PubMed: Trends in Alcohol Consumption and Binge Drinking in the United States (2018)