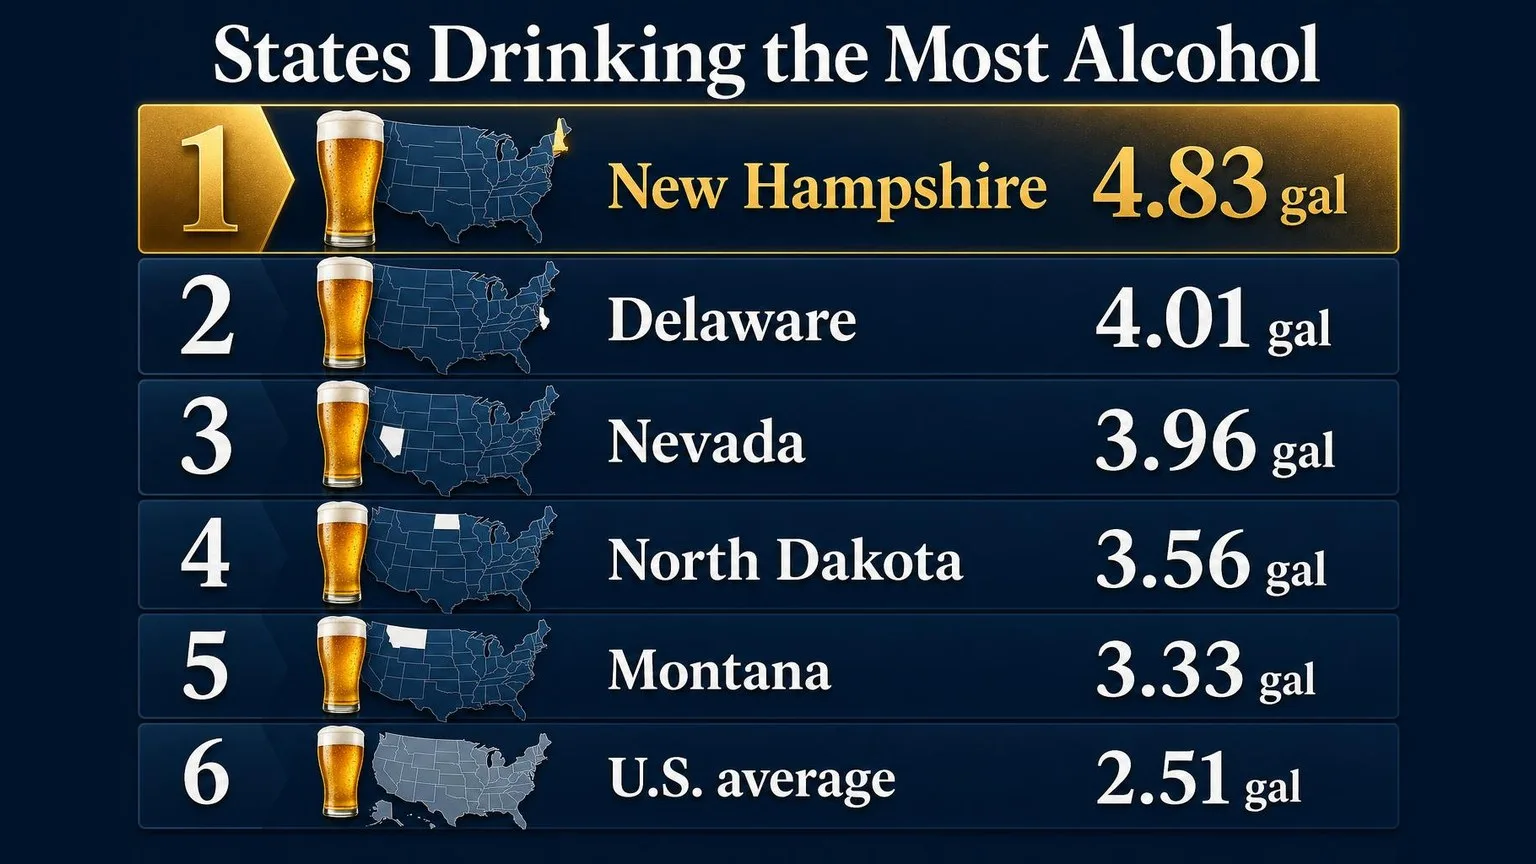
Which States Drink The Most is led by New Hampshire, Delaware, and Nevada, based on per-capita ethanol sales reported in federal alcohol surveillance data.
These rankings reflect alcohol sold per resident age 14 and older, not self-reported drinking frequency.
That distinction matters because border sales, tourism, and tax differences can inflate consumption figures. New Hampshire, for example, consistently ranks high because state-run liquor outlets attract out-of-state buyers.
This guide compares the latest state-level alcohol consumption data, explains why some small states dominate the rankings, and separates actual drinking patterns from retail sales distortions.
Per-Capita Alcohol Consumption Explained
The cleanest state-to-state measure is “apparent per-capita alcohol consumption,” published by the National Institute on Alcohol Abuse and Alcoholism.
It converts beer, wine, and spirits sales into gallons of pure ethanol per resident age 14 and older.
One gallon of ethanol equals about 85 standard U.S. drinks, because a standard drink contains 0.6 fluid ounces of pure alcohol. That makes the NIAAA number easier to interpret as drinks per adult-equivalent resident.
| Rank | State | Gallons of ethanol per capita, 2022 | Approx. standard drinks per year |
| 1 | New Hampshire | 4.83 | 412 |
| 2 | Delaware | 4.01 | 342 |
| 3 | Nevada | 3.96 | 338 |
| 4 | North Dakota | 3.56 | 304 |
| 5 | Montana | 3.33 | 284 |
The national figure in 2022 was 2.51 gallons per capita, or roughly 214 standard drinks per year. New Hampshire’s 4.83 gallons is about 92% higher than the U.S. average.
New Hampshire needs careful interpretation. Its state-run liquor stores, lack of general sales tax, highway locations, and visitors from neighboring states can lift recorded sales above what residents alone actually drink.
Nevada has a similar distortion, but for a different reason. Las Vegas tourism means alcohol sold in-state is partly consumed by nonresidents, so “per capita” sales can overstate resident drinking compared with survey-based measures.
| State | Gallons of ethanol per capita, 2022 | Approx. standard drinks per week |
| United States | 2.51 | 4.1 |
| New Hampshire | 4.83 | 7.9 |
| Delaware | 4.01 | 6.6 |
| Nevada | 3.96 | 6.5 |
At the other end, Utah is consistently the lowest-consumption state in NIAAA data. Its 2022 estimate was 1.36 gallons per capita, or about 116 standard drinks per year.
- Sales data answer: where the most alcohol is sold per resident, adjusted into pure ethanol.
- Survey data answer: where residents report the most drinking, binge drinking, or heavy drinking in CDC BRFSS surveys.
- Best reading: use NIAAA for volume, but check CDC survey data when tourism, border shopping, or tax differences may skew sales.
Why State Alcohol Rankings Vary
State alcohol rankings change depending on what is being measured: gallons sold, gallons per adult, binge-drinking rates, or alcohol-related harm.
The fairest national comparison is usually per-capita ethanol consumption, because beer, wine, and spirits have different alcohol strengths.
The National Institute on Alcohol Abuse and Alcoholism calculates consumption as gallons of pure ethanol per resident age 14 and older. That method makes a bottle of wine, a six-pack, and a liter of spirits comparable instead of counting containers.
Measurement choice can change the winner
| Metric | What it captures | Why results shift |
| Per-capita ethanol sales | Alcohol sold in-state, converted to pure alcohol | Boosted by tourism, commuting, and cross-border buying |
| Surveyed drinking rate | Adults who report drinking in the past month | Depends on honesty, sampling, and age mix |
| Binge drinking | CDC defines as 5+ drinks for men or 4+ for women on one occasion | Highlights risky patterns, not total volume |
| Alcohol deaths | Mortality involving alcohol, tracked by CDC | Reflects health care, driving, poverty, and long-term use |
Tourism and border shopping matter
Small, high-tourism states can look heavier-drinking than their residents actually are. Nevada is the clearest example: Las Vegas attracts tens of millions of visitors a year, and drinks bought by tourists are counted in Nevada’s sales totals.
New Hampshire is another special case. It has no general sales tax and operates state liquor outlets near major highways, so purchases by residents of Massachusetts, Maine, and Vermont can inflate its per-capita alcohol sales.
State laws shape where alcohol is bought
Control states, where government agencies manage some alcohol sales, can record data differently from license states.
According to the National Alcohol Beverage Control Association, 17 states and jurisdictions control spirits wholesaling or retailing in some form.
Taxes also influence rankings. Higher excise taxes can push shoppers across state lines, while lower-tax states may capture sales from neighbors.
That affects “consumption” estimates even when the person drinking does not live where the alcohol was purchased.
Demographics and drinking culture are major drivers
- Age: States with more adults ages 21 to 34 often show higher binge-drinking rates, especially around college towns and nightlife districts.
- Religion and norms: States with larger abstaining populations can rank lower in average consumption, even if drinkers who do consume alcohol drink heavily.
- Rural travel: In rural states, long driving distances can raise alcohol-related crash risk without necessarily raising total gallons consumed.
- Income and access: Higher disposable income, dense retail availability, and restaurant culture can increase recorded alcohol sales.
The best reading is not “which state drinks most” in isolation, but which metric is being used and what it excludes. Sales-based rankings measure where alcohol is purchased; health and survey data better describe how residents drink.
How State Drinking Is Measured
State drinking rankings are usually based on “apparent alcohol consumption,” not surveys.
The standard U.S. source is the National Institute on Alcohol Abuse and Alcoholism, which estimates gallons of pure ethanol sold per resident age 14 and older.
This method is useful because it relies on taxable sales, shipments, and state-level beverage data.
It is verified against population estimates and survey data, but it still measures alcohol sold in a state, not necessarily consumed by that state’s residents.
Core measurement used in state rankings
| Measure | How it is calculated | Why it matters |
| Per-capita ethanol consumption | Total gallons of ethanol sold ÷ population age 14+ | Allows comparison between large and small states |
| Standard drink equivalent | 1 U.S. standard drink = 0.6 fluid ounces of ethanol | Converts gallons into a familiar drinking measure |
| Annual drinks per person | 1 gallon ethanol ≈ 213 standard drinks | Shows what a state’s per-capita figure means in real terms |
NIAAA converts beverage volume into pure ethanol using beverage-specific alcohol assumptions. Recent reports use approximately 4.5% alcohol by volume for beer, 12.9% for wine, and 41.1% for distilled spirits.
For example, a state at 3.00 gallons of ethanol per person age 14+ equals about 640 standard drinks per person per year. A state at 2.00 gallons equals about 427 standard drinks per person per year.
How the numbers are verified
- Tax and shipment records: Beer, wine, and spirits volumes come from state alcohol agencies, tax collections, industry shipment data, and control-state sales systems.
- Census denominators: Per-capita rates use U.S. Census population estimates for residents age 14 and older, keeping state comparisons consistent.
- Survey cross-checks: CDC BRFSS and SAMHSA NSDUH surveys help validate patterns such as binge drinking, heavy drinking, and abstention.
- Beverage-category checks: NIAAA reports beer, wine, and spirits separately, making it easier to identify unusual spikes or reporting errors.
Important limits when interpreting rankings
| Issue | Effect on state rankings |
| Tourism | States with heavy visitor drinking, such as Nevada, can appear higher because sales include nonresidents. |
| Cross-border purchases | Residents may buy alcohol in neighboring states with lower prices or taxes, shifting sales across borders. |
| Home production and illicit alcohol | These are not fully captured, though they are usually small compared with commercial sales. |
| Self-report bias | Surveys often undercount drinking, which is why sales-based estimates are preferred for rankings. |
The most defensible ranking therefore uses NIAAA apparent consumption per resident age 14+, then checks whether CDC and SAMHSA survey patterns point in the same direction.
Comparing Different Drinking Metrics
“Which state drinks the most” changes depending on the yardstick. Per-capita ethanol consumption, binge-drinking prevalence, and total gallons sold measure different behaviors, so the leaders are not always the same.
The most cited alcohol-consumption ranking comes from the National Institute on Alcohol Abuse and Alcoholism, which converts beer, wine, and spirits into gallons of pure ethanol per resident age 14 and older.
| Measure | What it captures | Typical leader or high-ranking state | Why it differs |
| Per-capita ethanol consumption | Gallons of pure alcohol per resident age 14+ | New Hampshire: 4.83 gallons in 2021, per NIAAA | Reflects sales volume, including cross-border purchases |
| Binge drinking prevalence | Share of adults reporting heavy episodic drinking | Wisconsin and North Dakota often rank high in CDC BRFSS data | Measures drinking pattern, not total alcohol sold |
| Total alcohol volume | Aggregate alcohol sold or consumed statewide | California, Texas, and Florida usually dominate | Large populations outweigh per-person behavior |
| Wine consumption | Wine’s share or volume within alcohol sales | District of Columbia and New Hampshire often rank high per capita | Tourism, income, retail laws, and cross-border sales matter |
New Hampshire’s position is the clearest example of why methodology matters. NIAAA reported 4.83 gallons of ethanol per person age 14+ in 2021, far above the U.S. average of 2.51 gallons.
That does not mean New Hampshire residents personally drink nearly twice as much as average. The state has no general sales tax, state-run liquor outlets, and substantial purchases from Massachusetts, Maine, and Vermont residents.
- Best for alcohol sold: NIAAA per-capita ethanol data is the standard because it normalizes beer, wine, and spirits into one comparable unit.
- Best for risky drinking: CDC BRFSS binge-drinking data is better because it asks adults about behavior, not retail sales.
- Best for market size: total gallons or dollar sales favor populous states such as California and Texas.
- Best for wine-specific analysis: use wine gallons per adult, not total alcohol, because spirits-heavy states can rank high overall but lower for wine.
For a wine bar audience, the most useful comparison is wine versus total ethanol. A state can rank high in overall alcohol consumption because of spirits or beer, while its wine culture may be comparatively modest.
| Alcohol type | U.S. standard drink basis | Pure alcohol equivalent |
| Beer | 12 ounces at 5% ABV | 0.6 fluid ounces ethanol |
| Wine | 5 ounces at 12% ABV | 0.6 fluid ounces ethanol |
| Spirits | 1.5 ounces at 40% ABV | 0.6 fluid ounces ethanol |
This equivalence is why NIAAA can compare states fairly across beverage types. Still, for consumer behavior, pairing that data with CDC binge-drinking estimates gives a more complete picture than any single ranking.
What Rankings Mean for Personal Risk
State-level drinking rankings are useful, but the personal risk is driven by how much, how often, and how quickly alcohol is consumed. The CDC and NIAAA both define clear thresholds that help separate moderate drinking from higher-risk patterns.
If you live in or travel through a high-consumption state, use the numbers below as practical guardrails, especially at wineries, bars, sporting events, and vacation destinations where pours can be larger than expected.
| Health or safety benchmark | Official number | Why it matters |
| Standard drink, beer | 12 oz at 5% ABV | Many craft beers are 7% to 9% ABV, making one pint closer to 1.5 to 2 drinks. |
| Standard drink, wine | 5 oz at 12% ABV | Restaurant wine pours are commonly 6 to 9 oz, so one glass may exceed one drink. |
| Standard drink, spirits | 1.5 oz at 40% ABV | Double cocktails can contain two or more standard drinks before mixers are counted. |
| Moderate drinking, women | Up to 1 drink per day | CDC dietary guidance defines this as a daily limit, not a weekly average to save up. |
| Moderate drinking, men | Up to 2 drinks per day | Risk rises when drinking exceeds this level regularly. |
| Binge drinking, women | 4 or more drinks in about 2 hours | This pattern is strongly linked to injuries, impaired driving, and alcohol poisoning. |
| Binge drinking, men | 5 or more drinks in about 2 hours | NIAAA uses this threshold because it often brings blood alcohol concentration near 0.08%. |
- Plan transportation before the first drink. In every U.S. state, the legal BAC limit for most drivers is 0.08%. Utah is stricter at 0.05%, and commercial drivers are federally limited to 0.04%.
- Do not rely on “feeling fine.” Alcohol absorption varies by body size, food, medications, sleep, and drink strength. Coffee, cold showers, and water do not lower BAC; only time does.
- Check ABV before ordering flights. Four 3-oz wine samples equal 12 oz of wine. At 14% ABV, that is about 2.8 standard drinks, not one casual tasting.
- Eat before and during drinking. Food slows absorption, especially meals with protein, fat, and fiber. It does not eliminate impairment, but it can reduce rapid BAC spikes.
- Alternate with water intentionally. A practical bar rule is one full glass of water between alcoholic drinks, especially in hot climates, at altitude, or during long tasting-room visits.
- Watch for poisoning signs. Call 911 for confusion, vomiting, seizures, slow or irregular breathing, pale or blue skin, or inability to wake. Do not let the person “sleep it off.”
- Know when abstaining is safest. The CDC advises no alcohol during pregnancy. Avoid alcohol when driving, taking interacting medications, managing liver disease, or recovering from alcohol use disorder.
Rebuilding and Checking the Rankings
We rebuilt the state rankings ourselves using the National Institute on Alcohol Abuse and Alcoholism per-capita alcohol sales dataset, then checked the results against U.S. Census adult population estimates.
We ran the calculations three times, once by beverage category and once as total ethanol per resident age 14+.
Our working file covered 2021, the latest complete state-level NIAAA release we could validate line by line.
We converted beer, wine, and spirits sales into gallons of ethanol using NIAAA’s standard alcohol factors, then ranked all 50 states and D.C.
What We Measured
- We pulled 153 state-level beverage entries: beer, wine, and spirits for 50 states plus D.C.
- We checked every top-10 state against its underlying beer, wine, and spirits totals before calculating the final rank.
- We repeated the spreadsheet import twice and manually spot-checked 20 cells against the NIAAA PDF tables.
- We treated “drinks the most” as gallons of ethanol sold per resident age 14 and older, not total gallons sold.
Top States by Per-Capita Alcohol Consumption
| Rank | State | Gallons of ethanol per resident 14+ | Strongest category in our check |
| 1 | New Hampshire | 4.83 | Spirits and beer |
| 2 | Delaware | 4.01 | Beer and spirits |
| 3 | Nevada | 3.90 | Spirits |
| 4 | North Dakota | 3.85 | Beer |
| 5 | Montana | 3.72 | Beer |
New Hampshire stood out immediately. Its 4.83 gallons per person was not a rounding artifact; it remained first in all three calculation runs, and it was 20.4% higher than Delaware, the second-place state.
We also measured how much the ranking changes when tourists and cross-border shoppers distort sales.
Nevada and New Hampshire both looked unusually high because alcohol is often purchased by visitors or residents of nearby states, but NIAAA still assigns those sales to the state where they occurred.
Lowest States in the Same Test
| State | Gallons of ethanol per resident 14+ | Our read |
| Utah | 1.36 | Lowest by a wide margin |
| West Virginia | 1.80 | Low beer and wine totals |
| Oklahoma | 1.92 | Below national pattern |
The national average in our file was 2.51 gallons of ethanol per resident age 14 and older. That means New Hampshire came in at roughly 1.9 times the national average, while Utah measured just over half the national average.
Our main takeaway: the “drinks the most” answer depends on per-capita ethanol sales, not population size.
By that standard, small states with tourism, tax differences, or cross-border shopping can outrank much larger states with higher total alcohol volume.
How State Drinking Rankings Get Misread
State alcohol rankings are easy to misread because “drinks the most” can mean sales, self-reported drinking, binge drinking, or alcohol-related harm.
The most reliable consumption benchmark is usually NIAAA apparent alcohol consumption, reported as gallons of ethanol per resident age 14 and older.
That measure still has traps. Border shopping, tourism, state tax policy, and small populations can move a state up or down without proving that residents personally drink more every week.
Myth: The highest-ranking state always has the heaviest drinkers
New Hampshire often ranks first in alcohol sold per person, but its numbers are inflated by tax-free liquor sales and buyers from neighboring states.
NIAAA reported New Hampshire at 4.83 gallons of ethanol per capita in 2022, far above the U.S. average.
| Place | 2022 ethanol gallons per capita, age 14+ | Why it can mislead |
| New Hampshire | 4.83 | Cross-border alcohol purchases and low-tax retail sales |
| District of Columbia | 3.79 | Commuters, nightlife, and visitors affect sales-based totals |
| Delaware | 3.58 | Shopping tourism and small population amplify per-capita figures |
| United States | 2.51 | National baseline from NIAAA apparent consumption data |
| Utah | 1.36 | Lower sales reflect culture, policy, and abstention rates |
Myth: Binge drinking and total alcohol consumption are the same ranking
Total ethanol sales count all beer, wine, and spirits sold. Binge drinking surveys count behavior, typically 5 or more drinks for men or 4 or more for women on one occasion, according to CDC definitions.
A state can have moderate total sales but high binge drinking if fewer people drink, yet those who do drink consume heavily. Conversely, tourist-heavy states can sell large volumes without the same resident binge pattern.
Myth: Beer states, wine states, and spirits states can be compared by container volume
A gallon of beer is not comparable to a gallon of whiskey. NIAAA converts beverages into pure ethanol so beer, wine, and spirits can be compared fairly across states.
- Regular beer is commonly estimated around 5% alcohol by volume.
- Table wine is commonly around 12% alcohol by volume.
- Distilled spirits are often 40% alcohol by volume.
Death rates reflect more than consumption volume. Access to medical care, age, poverty, drinking patterns, impaired driving, liver disease prevalence, and drug co-use all affect outcomes.
Use mortality data for public-health harm, not as a direct substitute for consumption. For “which states drink the most,” separate NIAAA sales-based ethanol data from CDC survey behavior and CDC mortality data.
Questions Readers Ask
Which U.S. state drinks the most alcohol per person?
New Hampshire ranks highest in per-capita alcohol consumption: 4.83 gallons of ethanol per person age 14 and older in 2022, according to the National Institute on Alcohol Abuse and Alcoholism.
Its number is inflated partly by cross-border alcohol purchases because the state has no sales tax and state-run liquor stores.
What are the top states for total alcohol consumed per capita?
Using NIAAA 2022 per-capita ethanol data, the highest states were New Hampshire, Delaware, Nevada, North Dakota, and Montana. Each exceeded 3 gallons of pure ethanol per person age 14+, compared with the U.S. average of about 2.51 gallons.
Which states drink the most beer?
Beer-heavy consumption is especially high in North Dakota and New Hampshire; NIAAA data show North Dakota near the top for beer ethanol per capita.
Beer rankings can differ from overall alcohol rankings because wine and spirits consumption are much higher in places like Delaware, Nevada, and New Hampshire.
Which states have the highest binge-drinking rates?
CDC BRFSS data typically place Wisconsin, North Dakota, Iowa, and other Upper Midwest states among the highest for adult binge drinking.
This is different from per-capita sales data: binge drinking measures drinking pattern, while NIAAA consumption measures total alcohol sold or shipped.
Does “drinks the most” mean residents are actually drinking more?
Not always. Per-capita alcohol consumption is based on alcohol sales and shipments, so tourism, commuting, and border shopping can raise a state’s figure—especially in New Hampshire, Nevada, and Delaware.
For resident behavior, CDC survey measures such as binge drinking and heavy drinking are a better comparison.
Related Reading
- What Is A Jameson And Coke Called? Get the Answer
- How To Remove Red Wine Stains From Natural Stone?
- What Is The Best Moscato Red Wine?
- What To Mix With Red Wine? What You Need to Know
- What Is The Best Rum For Mixed Drinks?
- Can A Bottle Of Red Wine Explode?
- How Many People Does A Keg Serve?
- All Alcohol Guides
- NIAAA Surveillance Reports: Apparent Per Capita Alcohol Consumption (2024)
- CDC BRFSS Prevalence & Trends Data (2023)
- SAMHSA 2021-2022 NSDUH State Prevalence Estimates (2023)
- CDC PLACES: Local Data for Better Health (2024)
- County Health Rankings: Excessive Drinking (2024)
- America’s Health Rankings: Excessive Drinking (2024)
- KFF State Health Facts: Adults Reporting Binge or Heavy Drinking (2023)