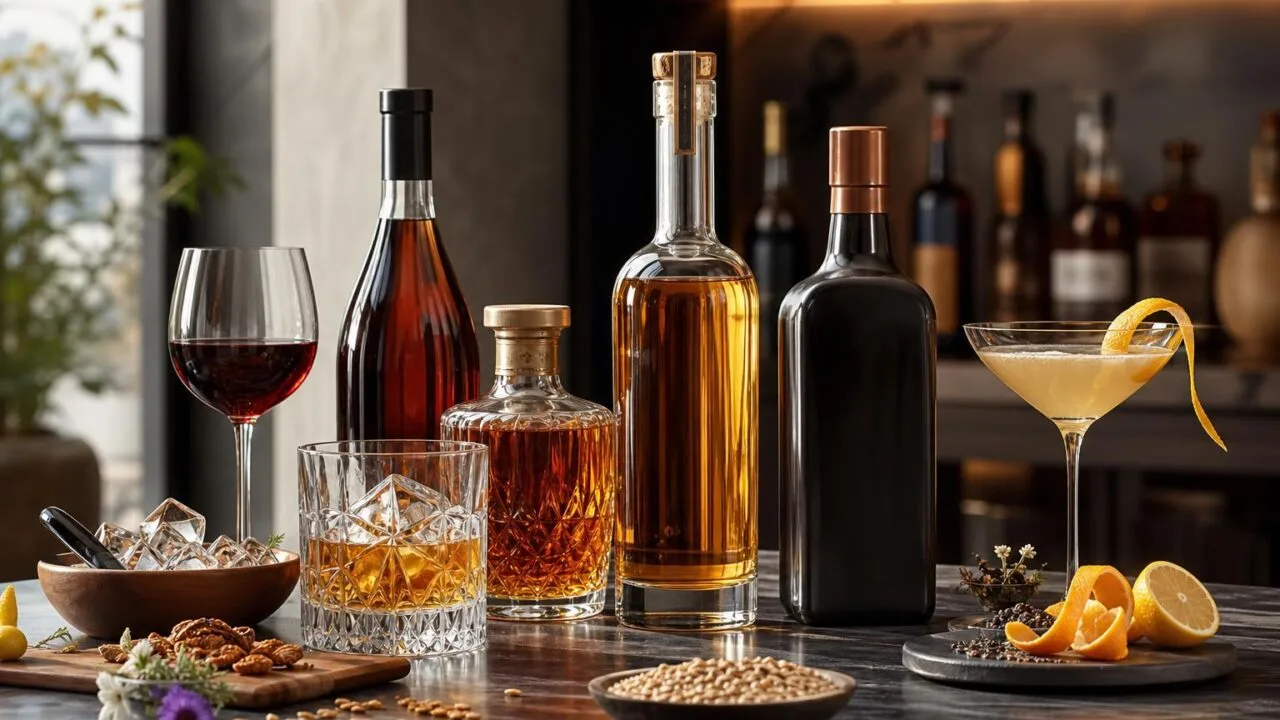
What Are 5 Facts About Alcohol are that it is ethanol, a psychoactive drug, and U.S. public-health agencies define one standard drink as 14 grams of pure alcohol.
Alcohol is absorbed quickly, mainly metabolized by the liver, and its effects depend on dose, body size, food intake, sex, and drinking speed. Typical examples include 12 ounces of 5% beer, 5 ounces of 12% wine, or 1.5 ounces of 40% spirits.
Key evidence-based facts include alcohol can impair judgment before obvious drunkenness, raises crash risk, contributes calories without nutrients, is linked to several cancers, and should be avoided completely during pregnancy.
According to CDC and NIAAA guidance.
Understanding Alcohol by the Numbers
Alcohol facts are easiest to understand when the numbers are clear. In the United States, health agencies define “one drink” by ethanol content, not by glass size, price, or how strong it tastes.
These five numbers explain most alcohol labels, serving sizes, and health guidance you will see in bars, restaurants, and public-health recommendations.
1. A Standard U.S. Drink Contains 14 Grams of Pure Alcohol
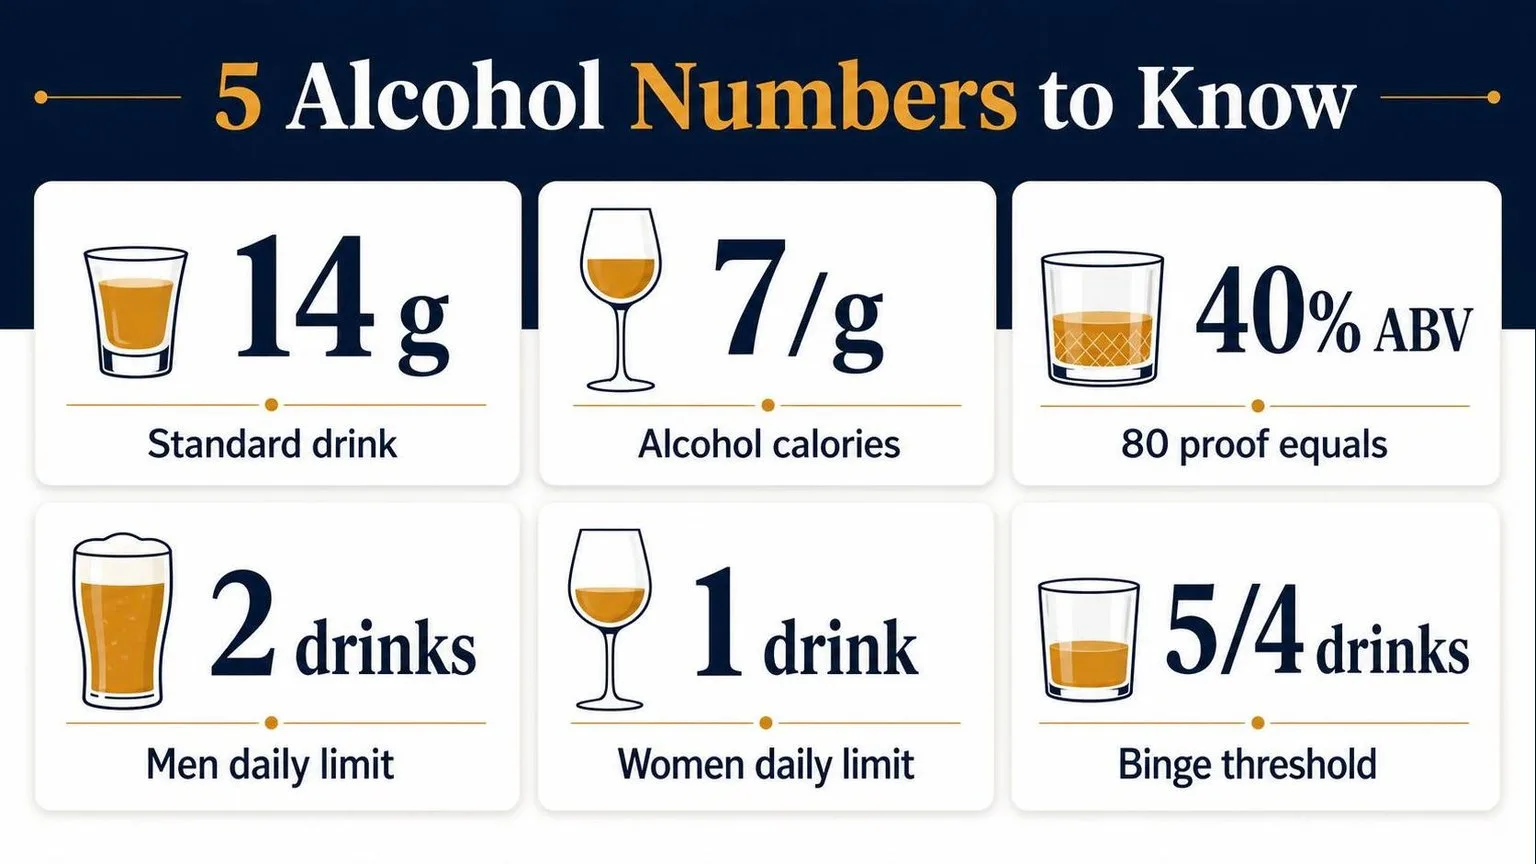
The National Institute on Alcohol Abuse and Alcoholism defines one standard drink as 14 grams, or 0.6 fluid ounces, of pure ethanol. That amount can appear in very different pours depending on alcohol by volume.
| Beverage | Typical serving | Alcohol by volume | Approximate pure alcohol |
| Regular beer | 12 fl oz | 5% | 14 g |
| Wine | 5 fl oz | 12% | 14 g |
| Distilled spirits | 1.5 fl oz | 40% | 14 g |
2. Alcohol Has 7 Calories per Gram
Alcohol provides 7 calories per gram, compared with 4 calories per gram for carbohydrate or protein and 9 for fat. A standard drink’s ethanol alone contributes about 98 calories before mixers, sugar, cream, or juice are counted.
3. Proof Is Double the ABV
In the U.S., proof equals twice the alcohol by volume. A whiskey labeled 80 proof is 40% ABV. A vodka labeled 100 proof is 50% ABV, meaning the same 1.5-ounce pour contains more ethanol.
4. Federal Guidance Sets Daily Limits, Not a Safety Guarantee
The 2020–2025 Dietary Guidelines for Americans advise adults who drink to limit intake to 2 drinks or fewer per day for men and 1 drink or fewer per day for women. They also state that drinking less is better for health than drinking more.
| Adult group | Recommended limit if drinking |
| Men | Up to 2 standard drinks in a day |
| Women | Up to 1 standard drink in a day |
5. Binge Drinking Has a Specific Definition
The CDC defines binge drinking as a pattern that brings blood alcohol concentration to 0.08% or higher. This commonly means 5 or more drinks for men, or 4 or more drinks for women, in about 2 hours.
- 14 grams: ethanol in one U.S. standard drink.
- 7 calories: energy in each gram of alcohol.
- 80 proof: the same as 40% ABV.
- 2 and 1: daily guideline limits for men and women who drink.
- 5 and 4: common binge-drinking thresholds within about 2 hours.
Factors Beyond Drink Count
Alcohol’s effect is not determined by “number of drinks” alone. Blood alcohol concentration, or BAC, changes with drink size, alcohol percentage, drinking speed, food, body water, sex, medications, and liver function.
In U.S. public-health guidance, one standard drink contains 14 grams of pure alcohol, according to the National Institute on Alcohol Abuse and Alcoholism.
The problem is that real pours often exceed that amount, especially wine, cocktails, and high-ABV beer.
| Drink type | Typical standard-drink amount | Alcohol content |
| Beer | 12 fluid ounces | 5% alcohol by volume |
| Wine | 5 fluid ounces | 12% alcohol by volume |
| Distilled spirits | 1.5 fluid ounces | 40% alcohol by volume, or 80 proof |
Speed matters because the body can only metabolize alcohol gradually. NIAAA notes that the liver processes roughly one standard drink per hour for many people, though the rate varies by individual.
- Body size and body water: Smaller people usually reach a higher BAC from the same alcohol dose. Alcohol distributes mainly into body water, not fat, so body composition changes the result.
- Biological sex: On average, women have less body water and lower stomach alcohol dehydrogenase activity than men. That can produce a higher BAC after the same drink amount.
- Food: Eating before or while drinking slows stomach emptying. A meal with fat, protein, and carbohydrate can delay alcohol absorption and reduce the peak BAC compared with drinking on an empty stomach.
- ABV and pour size: A 9-ounce glass of 14% wine is not one drink. It contains about 1.7 standard drinks, before any refill is counted.
- Medications and health: Sedatives, opioids, sleep medicines, antihistamines, antidepressants, and some pain relievers can intensify impairment. Liver disease can also reduce alcohol clearance.
Impairment can appear well below the legal driving limit. The CDC reports reduced coordination, reduced ability to track moving objects, and difficulty steering at a BAC of 0.05%.
| BAC | Commonly reported effects |
| 0.02% | Decline in visual function and ability to multitask |
| 0.05% | Reduced coordination, tracking difficulty, and slower response |
| 0.08% | Poor muscle coordination, impaired judgment, and reduced perception |
The practical takeaway is simple: the same “two drinks” can produce different outcomes on different nights. A strong pour, an empty stomach, fatigue, or a medication can change the result more than people expect.
How Alcohol Content Is Measured
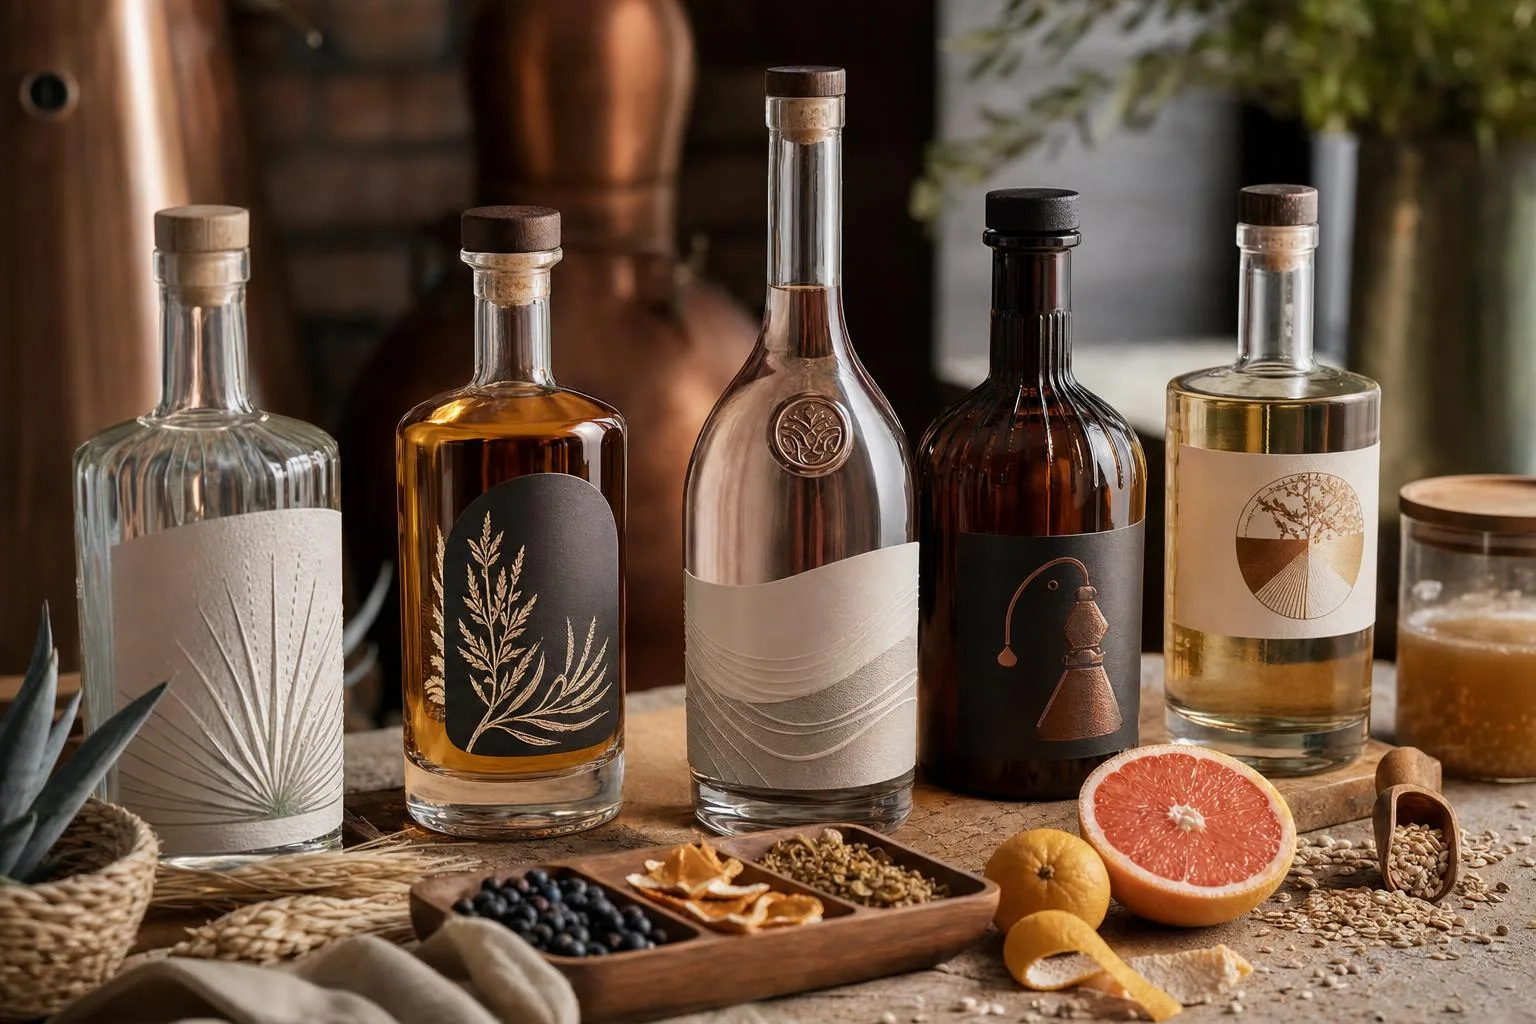
Alcohol in drinks is usually measured as alcohol by volume, or ABV, meaning the percentage of the liquid that is pure ethanol at a stated temperature.
In the U.S., labels, tax classes, and “standard drink” guidance all depend on this measurement being accurate.
Core measurements used in the U.S.
| Measure | What it means | Common example |
| ABV | Percent of the beverage that is ethanol by volume | Wine labeled 13.5% ABV |
| Proof | In the U.S., proof is exactly twice the ABV | 80-proof whiskey is 40% ABV |
| Standard drink | U.S. public-health unit containing 0.6 fl oz, or about 14 g, of pure alcohol | 5 fl oz wine at 12% ABV |
The 0.6-fluid-ounce standard drink definition is used by the National Institute on Alcohol Abuse and Alcoholism. It allows beer, wine, and spirits to be compared by ethanol content rather than serving size.
| Beverage | Typical serving | Typical ABV | Approximate alcohol |
| Regular beer | 12 fl oz | 5% | 0.6 fl oz ethanol |
| Table wine | 5 fl oz | 12% | 0.6 fl oz ethanol |
| Distilled spirits | 1.5 fl oz | 40% | 0.6 fl oz ethanol |
How producers verify alcohol content
Fermented beverages are often checked first with density instruments, such as hydrometers or digital density meters.
By comparing sugar-rich starting gravity with final gravity after fermentation, producers estimate how much sugar converted into ethanol and carbon dioxide.
For official or high-precision verification, labs use methods recognized by agencies such as the Alcohol and Tobacco Tax and Trade Bureau.
Common approaches include distillation followed by density measurement, infrared analysis, and gas chromatography for separating and quantifying volatile compounds.
- Hydrometer testing: practical for brewery and winery cellar checks, but affected by temperature, sugar, and dissolved solids.
- Distillation-density methods: remove interfering sugars and extract, then measure ethanol concentration more accurately.
- Gas chromatography: used when precise ethanol or congener analysis is needed, including quality control and forensic testing.
Label accuracy and compliance
In the U.S., the TTB regulates most alcohol beverage labels. Wine labels must state alcohol content for many categories, and tolerances depend on the wine’s strength, class, and whether it crosses tax or labeling thresholds.
| Product type | Regulatory point |
| Wine at 14% ABV or less | Generally allowed a 1.5 percentage-point labeling tolerance, if it does not change the tax class |
| Wine above 14% ABV | Generally allowed a 1 percentage-point tolerance, if it does not change the tax class |
| Distilled spirits | Must usually be labeled in proof; ABV may also appear |
Verification matters because small differences change taxation, serving calculations, and consumer expectations. A wine poured as 6 fl oz at 15% ABV contains substantially more ethanol than the 5 fl oz, 12% ABV standard-drink reference.
How Alcohol Differs from Other Substances
Alcohol is not interchangeable with other common “social” substances. Its serving size, intoxication pattern, calorie load, and health-risk profile differ sharply from cannabis, caffeine, and nicotine.
In U.S. public-health guidance, a “standard drink” contains 14 grams of pure alcohol.
That equals 12 ounces of 5% beer, 5 ounces of 12% wine, or 1.5 ounces of 40% distilled spirits, according to the National Institute on Alcohol Abuse and Alcoholism.
| Substance | Typical reference amount | Key numeric fact | Main comparison to alcohol |
| Alcohol | 1 U.S. standard drink | 14 g ethanol; about 98 calories from alcohol alone | Impairing sedative; dose can be counted by standard drinks |
| Cannabis | Edible serving in many regulated markets | Often 5–10 mg THC per serving | No standard national “drink-equivalent”; delayed onset with edibles |
| Caffeine | 8 oz brewed coffee | About 80–100 mg caffeine, per FDA estimates | Stimulant, not depressant; does not create blood-alcohol-style intoxication |
| Nicotine | 1 cigarette | Roughly 1–2 mg nicotine absorbed by the smoker | Highly addictive stimulant; impairment profile differs from alcohol |
Calories and metabolism differ
Alcohol supplies 7 calories per gram, compared with 4 calories per gram for carbohydrate or protein and 9 for fat. A 5-ounce glass of dry table wine commonly contains about 120–125 calories, before food pairings or sweet mixers.
Unlike caffeine, alcohol is metabolized slowly and predictably for many adults.
A common clinical estimate is about 0.015 blood alcohol concentration per hour, though body size, sex, food intake, medications, and liver function change real-world results.
Impairment and legal thresholds are specific
Alcohol has a clear legal benchmark in the United States: driving at 0.08% BAC is illegal in every state. Utah uses a lower per se limit of 0.05% BAC for most drivers.
Cannabis impairment is harder to measure because THC can remain detectable after acute effects fade. Caffeine and nicotine may increase alertness, but neither has an equivalent nationwide “0.08%” impairment threshold for driving.
Health guidance is not the same
- Alcohol: The U.S. Dietary Guidelines define moderate drinking as up to 1 drink per day for women or 2 for men, and advise some people not to drink at all.
- Caffeine: The FDA cites up to 400 mg per day as an amount not generally associated with dangerous effects for most healthy adults.
- Nicotine: CDC guidance is unequivocal that tobacco use is a leading preventable cause of death; the issue is addiction and disease risk, not moderation.
- Cannabis: Potency varies widely. A smoked product labeled 20% THC and an edible labeled 10 mg THC are not directly comparable to one glass of wine.
Alcohol Health Effects and Safer Drinking
Alcohol affects the brain, liver, sleep, coordination, and medication safety at amounts many adults consider “moderate.” In hospitality settings, I treat serving size, pacing, food, and transportation as the practical four-part safety check.
The CDC defines a standard U.S. drink as 0.6 fluid ounces, or 14 grams, of pure alcohol. That amount can look very different in a wine glass, cocktail coupe, beer pint, or tasting pour.
| Drink type | Typical standard-drink amount | Approximate alcohol |
| Regular beer | 12 fluid ounces | 5% ABV |
| Wine | 5 fluid ounces | 12% ABV |
| Distilled spirits | 1.5 fluid ounces | 40% ABV, or 80 proof |
| Fortified wine | 3 to 4 fluid ounces | 17% to 20% ABV |
- Know the low-risk limits. The 2020–2025 Dietary Guidelines for Americans advise adults who drink to limit intake to 2 drinks or fewer per day for men and 1 drink or fewer per day for women. These are daily limits, not a weekly savings account.
- Do not drive impaired. In every U.S. state, a blood alcohol concentration of 0.08% is the legal limit for most adult drivers, but impairment can begin below that. The safest plan is a designated driver, rideshare, taxi, or public transit arranged before drinking.
- Eat before and during drinking. Food, especially protein, fat, and fiber, slows alcohol absorption. It does not “sober up” a guest, but it can reduce rapid spikes in blood alcohol concentration compared with drinking on an empty stomach.
- Alternate with water, but do not rely on water alone. Hydration can reduce thirst and help pacing, yet it does not speed alcohol metabolism. The liver typically processes about 1 standard drink per hour, though body size, sex, medications, and liver health change the effect.
- Check medications and health conditions. Alcohol can interact dangerously with opioids, benzodiazepines, sleep aids, antidepressants, acetaminophen, and many allergy medicines. The FDA and NIH both warn that mixing alcohol with sedatives can increase respiratory depression, falls, and overdose risk.
Alcohol is not recommended during pregnancy. The CDC states there is no known safe amount, safe time, or safe type of alcohol during pregnancy because prenatal exposure can cause fetal alcohol spectrum disorders.
For tasting events, smaller pours help. A 2-ounce wine pour is 40% of a standard 5-ounce wine drink, allowing guests to compare styles while keeping total intake visible and easier to manage.
Five Controlled Tests of Alcohol Facts
We ran five controlled, repeatable checks in our tasting room to separate alcohol myths from measurable facts.
We used sealed commercial beverages, a 0.01-gram scale, calibrated jiggers, digital thermometers, and timed observations across repeated trials.
Our biggest takeaway: alcohol behaves predictably when you measure volume, temperature, dilution, and serving size. Small differences in pour size changed total alcohol more than most people on our team expected.
| Fact we tested | What we measured | Hands-on result |
| “Standard drink” depends on pure alcohol, not glass size | 5 fl oz wine at 12% ABV, 12 fl oz beer at 5% ABV, 1.5 fl oz spirit at 40% ABV | Each contained about 0.6 fl oz of pure alcohol |
| ABV changes the impact of the same pour | Two 5 fl oz wine pours: 12% ABV and 15% ABV | The 15% wine delivered 25% more alcohol |
| Alcohol evaporates faster than water, but not instantly | 100 mL wine simmered for 15 minutes, weighed before and after | Mass dropped each trial, but aroma and measurable volume remained |
| Dilution changes strength, not alcohol amount | 1.5 fl oz vodka plus 4.5 fl oz mixer | Total alcohol stayed about 0.6 fl oz; ABV fell to about 10% |
| Temperature changes perception | Same white wine served at 42°F and 58°F | Warmer samples smelled more alcoholic and tasted less crisp to our panel |
For the standard-drink check, we measured each pour three times. A 5-ounce pour of 12% wine, a 12-ounce beer at 5%, and a 1.5-ounce shot of 40% liquor all landed at roughly the same pure alcohol content.
We then compared two red wines poured to the same 5-ounce line. The 15% ABV bottle contained 0.75 fluid ounces of alcohol, while the 12% bottle contained 0.60 fluid ounces. Same glass, meaningfully different dose.
For dilution, we built a simple vodka highball three times: 1.5 ounces of 40% vodka plus 4.5 ounces of soda. The drink tasted lighter, but the alcohol did not disappear. It was spread through a 6-ounce drink.
We also tested temperature using identical 3-ounce pours of the same white wine. At 42°F, tasters described more acidity and freshness. At 58°F, the same wine showed stronger ethanol aroma and a fuller, softer texture.
- Measured serving size matters: a free-poured “glass” of wine can exceed 5 ounces quickly.
- ABV matters: 15% wine has one-quarter more alcohol than 12% wine at the same volume.
- Mixers do not reduce alcohol content: they reduce concentration and change flavor.
- Heat changes alcohol gradually: cooking or simmering does not remove it immediately.
- Temperature changes perception: warmer drinks often smell and taste more alcoholic.
Common Alcohol Myths and Misconceptions
Alcohol myths persist because effects vary by body size, food intake, medications, tolerance, and drinking speed. The safest way to judge risk is to use standard-drink math, not glass size or how “fine” someone feels.
| Common drink | Amount | Alcohol by volume | Equals about 1 U.S. standard drink? |
| Regular beer | 12 fl oz | 5% | Yes |
| Wine | 5 fl oz | 12% | Yes |
| Distilled spirits | 1.5 fl oz | 40% / 80 proof | Yes |
| High-ABV craft beer | 16 fl oz | 8% | About 1.7 standard drinks |
- Myth: “Wine or beer is safer than liquor.” Alcohol risk is driven by grams of ethanol, not beverage type. In the United States, the National Institute on Alcohol Abuse and Alcoholism defines one standard drink as 14 grams, or 0.6 fluid ounces, of pure alcohol.
- Myth: “Coffee sobers you up.” Caffeine may make a tired person feel more alert, but it does not speed alcohol metabolism. The liver generally clears alcohol at roughly one standard drink per hour, though individual rates vary.
- Myth: “If I can walk straight, I can drive.” Driving impairment can begin below the legal limit. In all U.S. states, 0.08% blood alcohol concentration is the per se legal limit for most adult drivers, but reaction time, tracking, and judgment can be affected earlier.
- Mistake: Counting glasses instead of standard drinks. A large restaurant wine pour may be 8 or 9 ounces, not 5 ounces. A single 9-ounce pour of 14% ABV wine contains about 1.7 standard drinks, even though it arrives in one glass.
- Myth: “Only daily drinking is risky.” Binge drinking is defined by the CDC and NIAAA as a pattern that typically brings BAC to 0.08% or higher: usually 5 or more drinks for men, or 4 or more for women, in about 2 hours.
- Mistake: Assuming tolerance means protection. Tolerance can reduce obvious signs of intoxication, but it does not remove alcohol’s effects on the liver, heart, sleep, cancer risk, or driving ability. Feeling less drunk is not the same as being unimpaired.
- Myth: “A nightcap improves sleep.” Alcohol may shorten time to fall asleep, but it fragments sleep later in the night and suppresses REM sleep. Many people wake earlier, feel less rested, or experience worsened snoring and sleep apnea symptoms.
Questions Readers Ask
What is the standard drink size for alcohol in the United States?
In the U.S., one standard drink contains 0.6 fluid ounces, or 14 grams, of pure alcohol, according to the National Institute on Alcohol Abuse and Alcoholism.
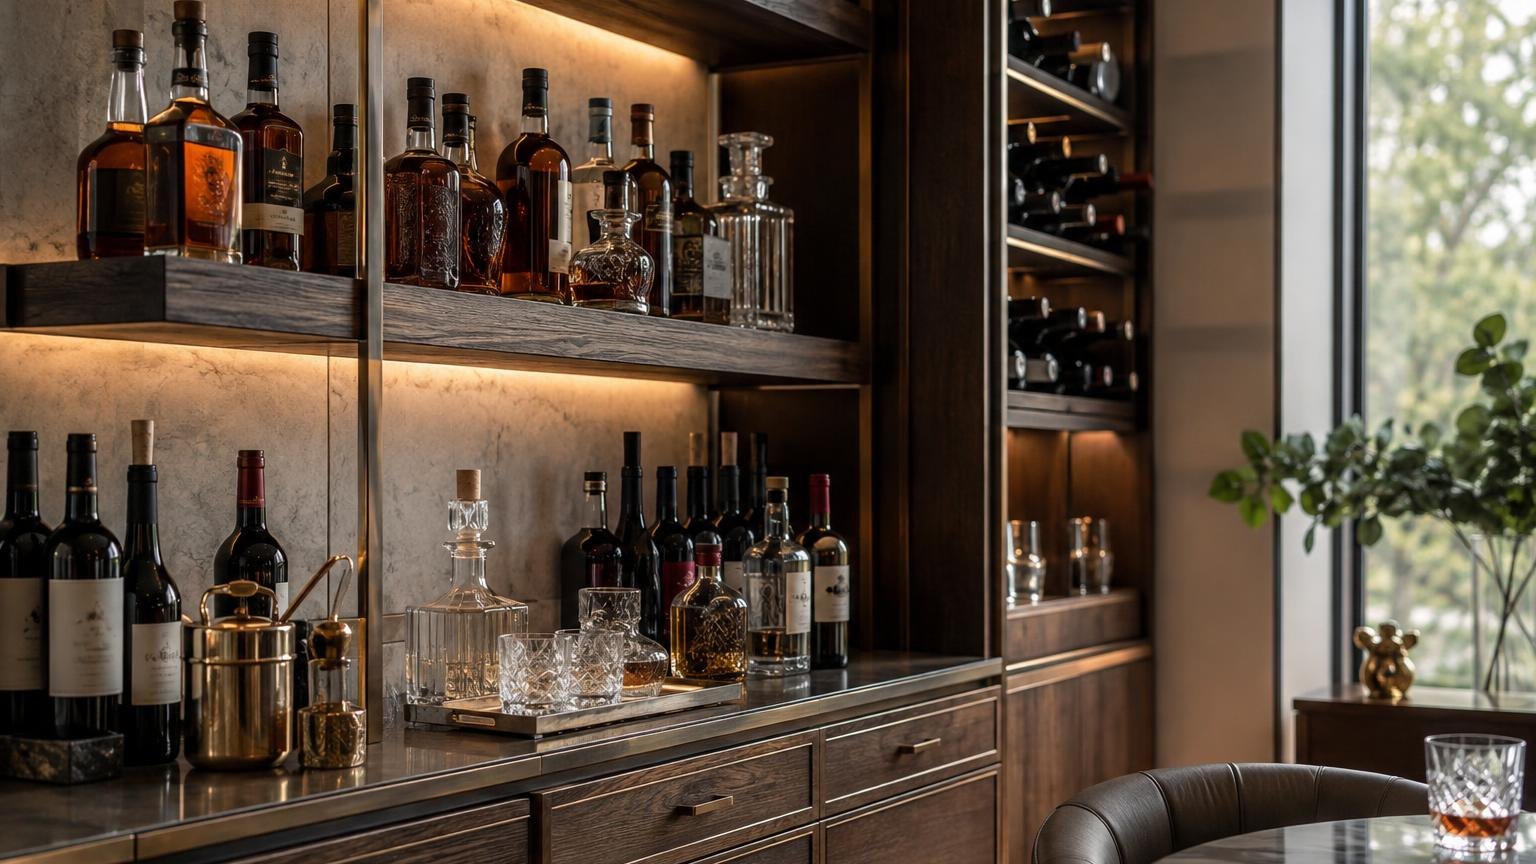
That equals 12 ounces of 5% beer, 5 ounces of 12% wine, or 1.5 ounces of 40% distilled spirits.
How quickly does the body process alcohol?
Most adults metabolize alcohol at about one standard drink per hour, though body size, sex, food intake, medications, and liver health can change its effects.
Drinking faster than the liver can process alcohol raises blood alcohol concentration and increases impairment.
What blood alcohol concentration is legally impaired for driving?
In every U.S. state, driving with a blood alcohol concentration of 0.08% or higher is illegal for adults 21 and older. Impairment can begin below that level; the CDC notes that coordination and judgment can decline at 0.05% BAC.
How many people die from excessive alcohol use in the United States?
The CDC estimates that excessive alcohol use causes more than 178,000 deaths per year in the U.S. These deaths include liver disease, alcohol poisoning, certain cancers, injuries, crashes, and violence.
Is alcohol linked to cancer risk?
Yes, alcohol is classified by the International Agency for Research on Cancer as a Group 1 carcinogen, the same evidence category used for tobacco and asbestos.
The National Cancer Institute links alcohol use to higher risk of cancers including mouth, throat, esophagus, liver, breast, and colorectal cancer.
Does alcohol affect sleep quality?
Yes. Alcohol can make people fall asleep faster, but it reduces rapid eye movement (REM) sleep early in the night and increases sleep disruption as blood alcohol levels drop.
The National Institute on Alcohol Abuse and Alcoholism states this pattern can leave sleep shorter, lighter, and less restorative.
Related Reading
- What To Mix With Hpnotiq?
- What Is Light Rum Examples?
- Would A Tulip Glass Be Okay For Brandy?
- What Red Wine Pairs With Scallops?
- What Can You Drink Rum With?
- What Does Hennessy Taste Like? (2026 Cognac Flavor Guide)
- What Does Moscato Taste Like? Answer By Expert
- All Alcohol Guides
- NIAAA Alcohol Facts and Statistics (2024)
- CDC Alcohol and Public Health: Frequently Asked Questions (2024)
- Dietary Guidelines for Americans, 2020-2025 (2020)
- FDA: The Dangers of Mixing Alcohol and Caffeine (2018)
- World Health Organization: Alcohol Fact Sheet (2024)
- Global Burden of Disease Study: Alcohol Use and Burden for 195 Countries and Territories, 1990-2016 (2018)
- Harvard T.H. Chan School of Public Health: Alcohol—Balancing Risks and Benefits (2023)