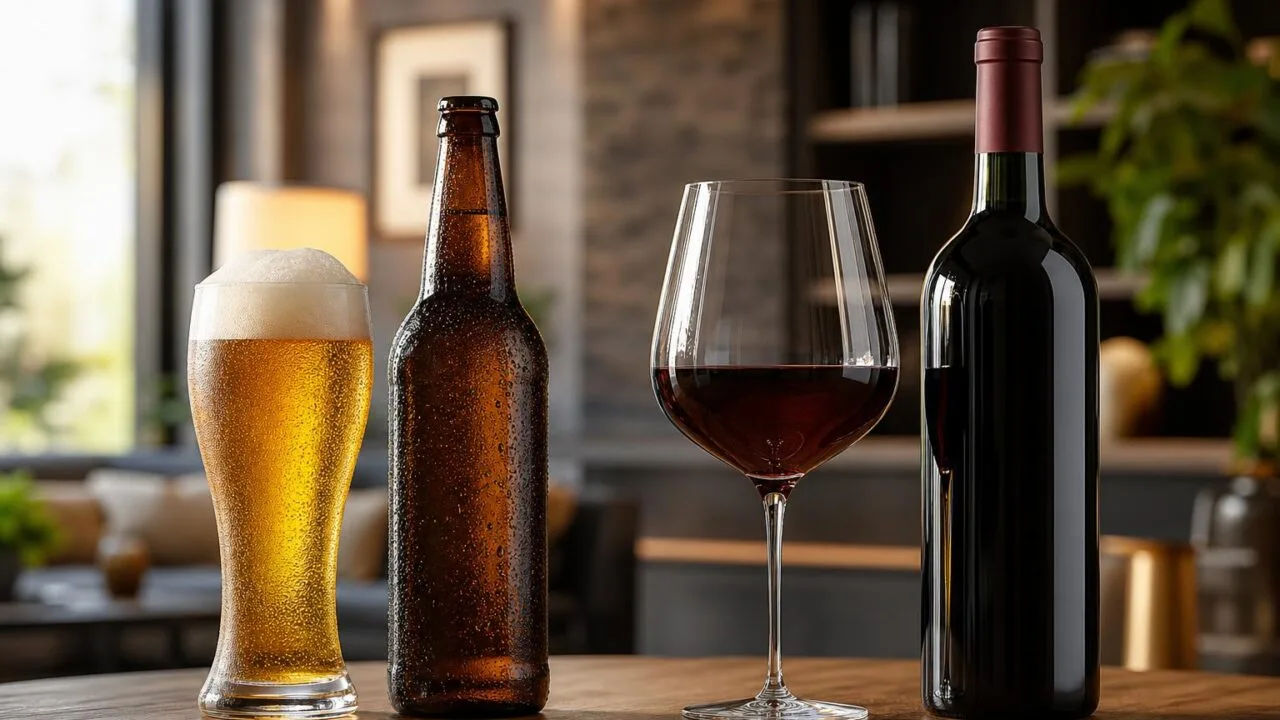
Do Americans Drink More Wine Or Beer is answered by beer: Americans consume far more beer than wine by volume and by pure alcohol.
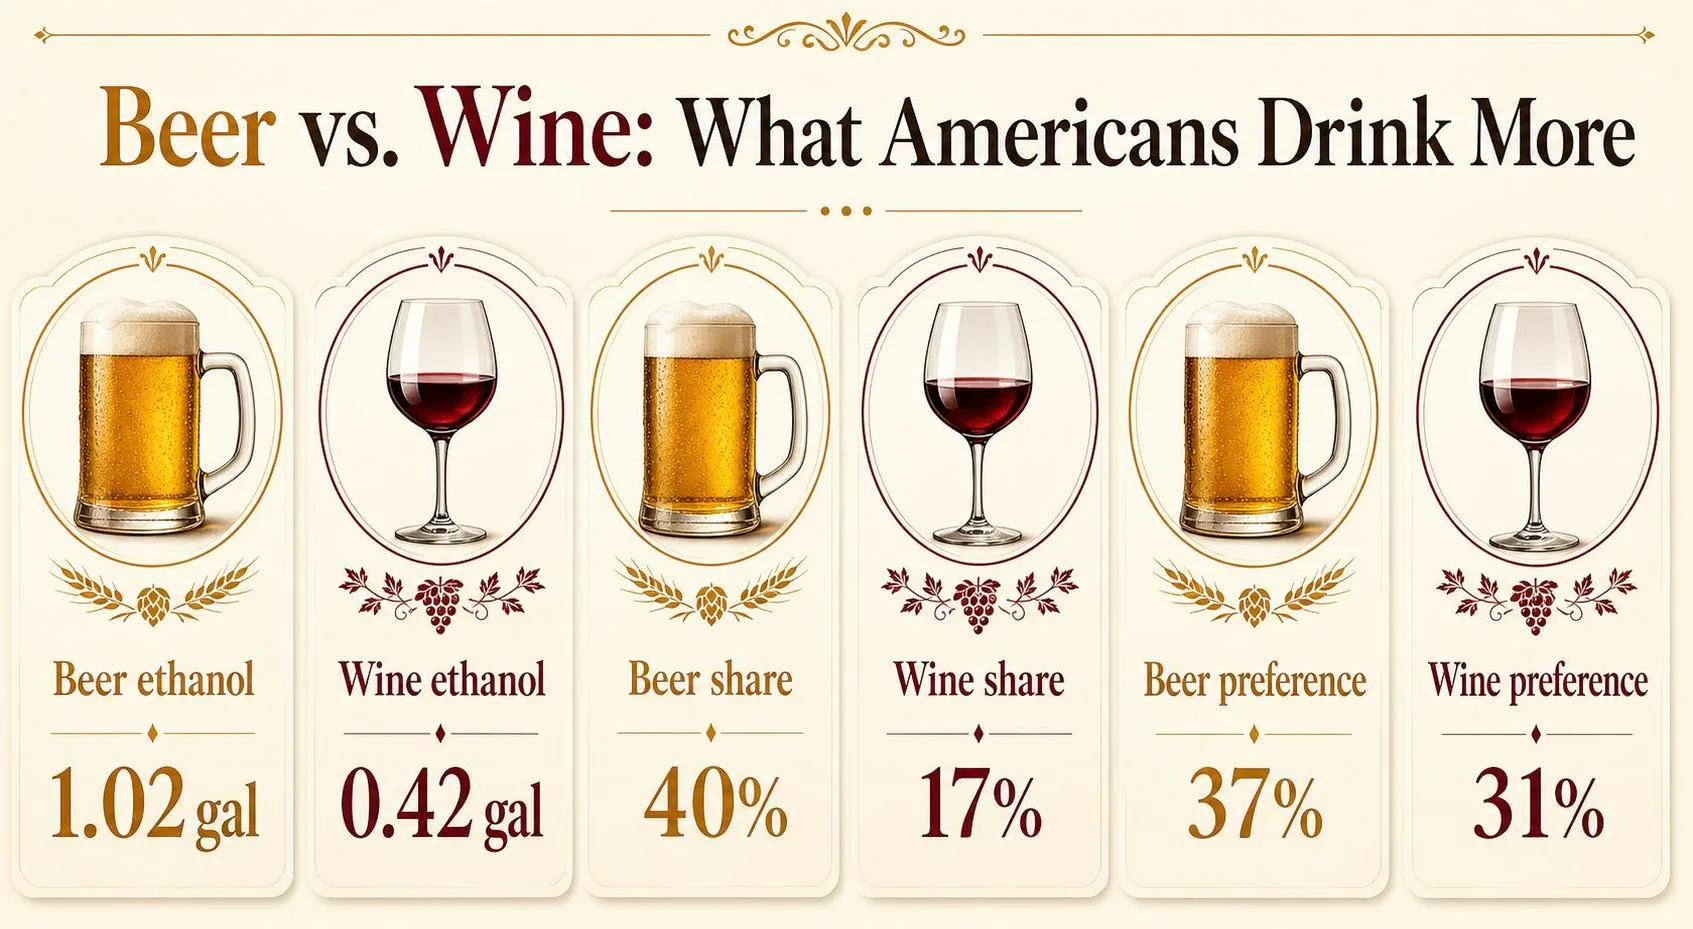
Federal NIAAA data show beer supplied about 1.04 gallons of ethanol per person age 14+ in 2022, versus about 0.43 from wine.
That gap reflects everyday purchasing too: beer remains the larger U.S. category in servings, retail shelf space, and bar menus, even as wine leads in some higher-income and older drinking segments.
This article compares beer and wine using consumption volume, alcohol-equivalent measures, sales trends, and demographic patterns, so the answer is based on measurable drinking behavior—not stereotypes about American taste.
Beer Exceeds Wine in Consumption
Americans drink more beer than wine by total liquid volume and by pure alcohol consumed. Wine is a major category, but beer remains the larger everyday beverage in national consumption data.
The clearest comparison comes from federal “apparent consumption” data, which estimates alcohol sold into the market rather than surveying memory or preference.
The National Institute on Alcohol Abuse and Alcoholism reports consumption in gallons of pure ethanol, which makes beer, wine, and spirits comparable.
| Measure | Beer | Wine | What it means |
| Per-capita ethanol, age 14+, 2022 | About 1.02 gallons | About 0.42 gallons | Beer supplied roughly 2.4 times as much pure alcohol as wine. |
| Share of total U.S. ethanol consumption, 2022 | About 40% | About 17% | Wine was less than half beer’s share of alcohol consumed. |
| Retail-equivalent beverage volume, recent U.S. market estimates | Roughly 6 billion gallons annually | Roughly 1 billion gallons annually | By liquid volume, beer is about six times larger because it is lower in alcohol. |
Volume can be misleading unless alcohol strength is considered. A 12-ounce beer at 5% ABV contains about 0.6 fluid ounces of pure alcohol. A 5-ounce glass of wine at 12% ABV contains about the same amount.
That is why the ethanol comparison matters. Even after adjusting for serving size and alcohol strength, beer still exceeds wine nationally.
Spirits have recently competed closely with, and in some years surpassed, beer by ethanol share, but wine remains clearly below both.
| Standard drink comparison | Typical serving | Typical ABV | Pure alcohol |
| Beer | 12 ounces | 5% | 0.6 ounces |
| Wine | 5 ounces | 12% | 0.6 ounces |
Preference surveys tell a slightly different story because they ask what drinkers choose most often. Gallup’s 2023 poll found beer first among U.S. drinkers at 37%, followed by wine at 31% and liquor at 29%.
- Men favor beer heavily: Gallup has consistently found beer is the top choice among male drinkers.
- Women are more likely to choose wine: wine often leads among female drinkers, even though total national beer volume remains higher.
- Age matters: younger legal-age drinkers are more fragmented across beer, spirits, cocktails, and wine than older drinkers.
The bottom line: Americans drink more beer than wine overall. Wine has strong demographic pockets and high cultural visibility, but beer leads in gallons consumed, standard-drink equivalents, and national alcohol share.
Meaning of Drink More Changes Answer
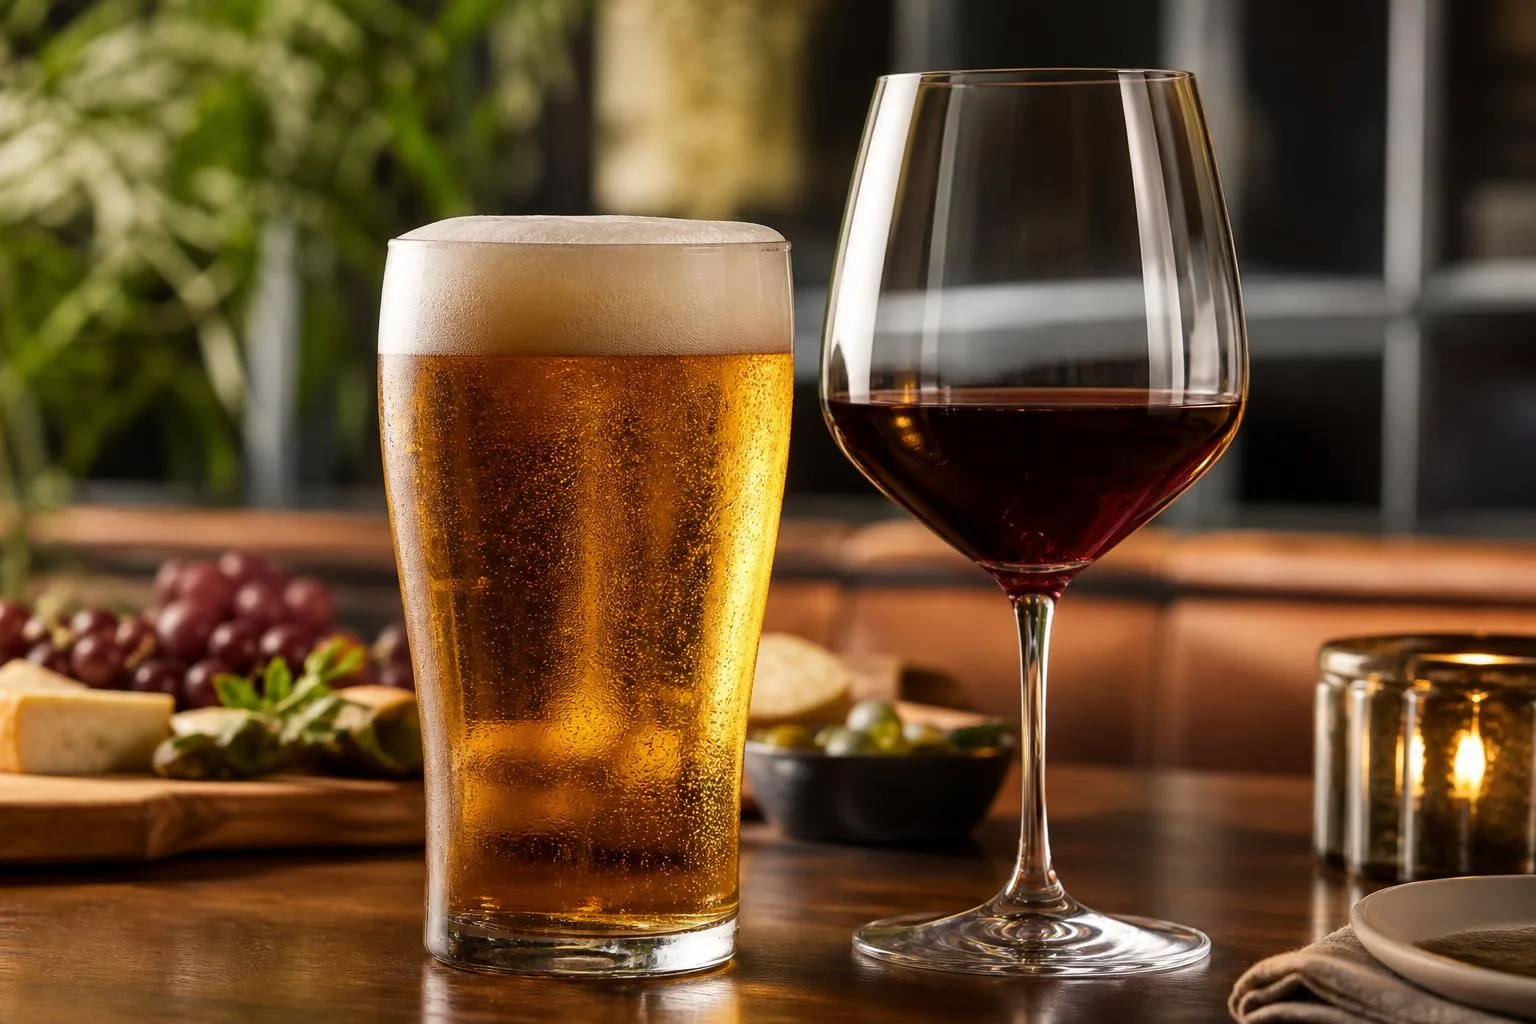
The answer changes depending on what “drink more” means. By beverage volume, Americans drink far more beer; by alcohol content or stated preference, the gap narrows because wine is stronger per ounce and is consumed differently.
Government, industry, and survey sources also measure different things: shipments, retail sales, self-reported drinking, or ethanol consumed. Those are not interchangeable.
Measurement method changes the winner
| Measure | What it captures | Typical result |
| Beverage gallons | Total liquid volume sold or consumed | Beer leads by a wide margin because a standard beer serving is much larger than a wine pour. |
| Pure alcohol | Ethanol consumed after adjusting for alcohol by volume | Beer still usually exceeds wine, but the difference is much smaller. |
| Consumer preference | What drinkers say they drink most often | Beer and wine can be close, depending on age, gender, income, and survey year. |
| Retail dollars | Money spent, not liquid consumed | Wine can look stronger because bottles often cost more per ounce than beer. |
Serving size and alcohol content matter
The National Institute on Alcohol Abuse and Alcoholism defines one U.S. standard drink as containing about 0.6 fluid ounces of pure alcohol. That makes beer and wine look more equal per serving than per ounce.
| Drink | Typical serving | Typical ABV | Pure alcohol |
| Beer | 12 fluid ounces | 5% | About 0.6 fluid ounces |
| Wine | 5 fluid ounces | 12% | About 0.6 fluid ounces |
| Distilled spirits | 1.5 fluid ounces | 40% | About 0.6 fluid ounces |
Demographics and occasions shift the answer
- Gender: Gallup has repeatedly found men more likely to name beer as their most-consumed alcoholic beverage, while women are more likely to name wine.
- Age: Younger adults are more fragmented across beer, wine, spirits, hard seltzer, and cocktails. Older drinkers tend to give wine a stronger share.
- Income and education: Wine consumption is more concentrated among higher-income and college-educated households, which can raise wine’s share in dollar-based data.
- Occasion: Beer performs especially well at sports events, bars, cookouts, and casual gatherings. Wine is stronger with meals, holidays, entertaining, and at-home drinking.
Category definitions can blur the line
Some datasets separate beer from hard seltzer, flavored malt beverages, cider, and ready-to-drink cocktails. Others group malt-based drinks with beer.
That classification can materially change beer’s reported share, especially after the hard-seltzer boom.
Wine has similar boundary issues. Sparkling wine, vermouth, wine cocktails, and canned wine may be included or excluded depending on the source. Always check the category definition before comparing beer and wine totals.
Units Used in Beer-Wine Comparisons
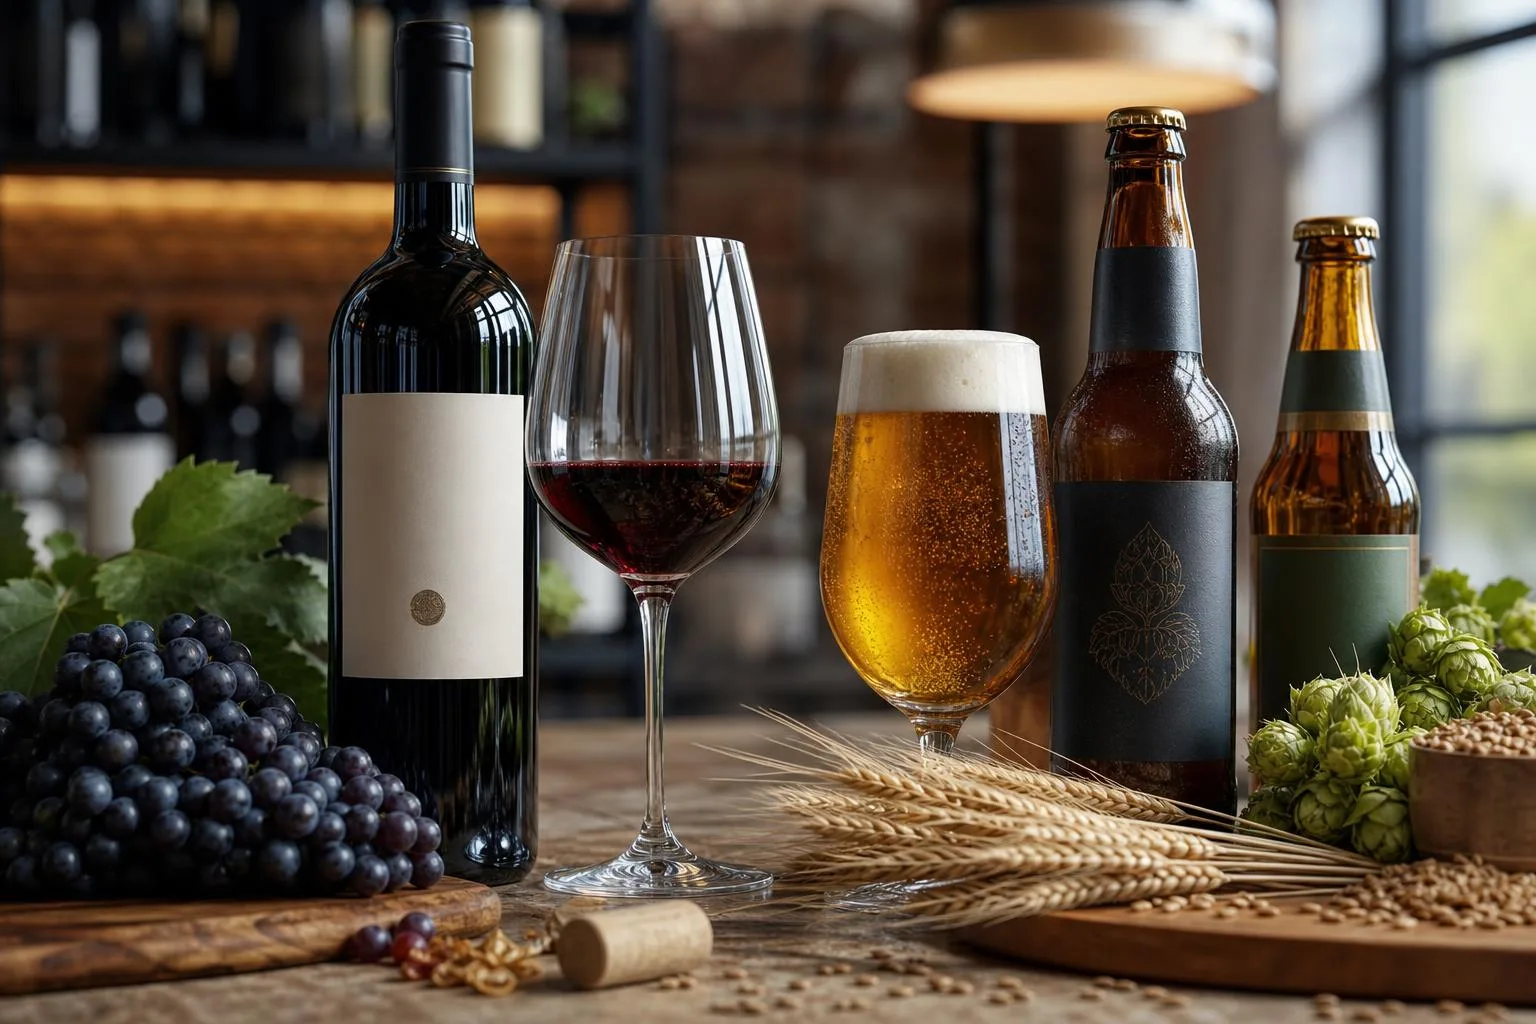
Beer-versus-wine comparisons depend on the unit: liquid gallons, pure alcohol, standard drinks, or survey-reported drinking.
Public-health agencies usually prefer “apparent alcohol consumption,” because it is built from taxed sales and shipments rather than memory-based self-reporting.
The main U.S. source is the National Institute on Alcohol Abuse and Alcoholism, which publishes annual apparent-consumption estimates for people age 14 and older.
NIAAA compiles beverage-specific ethanol volumes from federal and state alcohol tax records, shipment data, and population estimates.
| Measure | Beer | Wine | Why it matters |
| Typical U.S. standard drink | 12 fl oz at 5% alcohol | 5 fl oz at 12% alcohol | Both contain about 0.6 fl oz of pure alcohol |
| NIAAA ethanol assumption often used in surveillance | About 4.5% alcohol by volume | About 12.9% alcohol by volume | Converts beverage gallons into gallons of ethanol |
| Retail volume scale | Measured in barrels; 1 U.S. beer barrel equals 31 gallons | Measured in wine gallons | Beer dominates liquid volume because a serving is larger |
Verification starts with the Alcohol and Tobacco Tax and Trade Bureau. Producers, importers, and wholesalers report taxable removals, imports, and inventories.
Those records are difficult to replace with estimates because excise taxes are owed on the product moving through the system.
NIAAA then adjusts and standardizes those data by beverage type.
The result is not “how much Americans say they drank,” but how much alcohol entered legal channels for consumption, expressed as gallons of ethanol per person aged 14 or older.
- Beer Institute and TTB data help verify beer shipments, imports, and taxable removals.
- Wine Institute and TTB data help verify wine consumption, shipments, and import flows.
- U.S. Census population estimates convert national totals into per-capita rates.
- NSDUH and CDC survey data check drinking patterns, but surveys usually undercount total alcohol consumed.
For consumer-facing comparisons, “standard drinks” are usually clearest. A six-pack of 12-ounce beer contains six standard drinks if each beer is near 5% ABV. A 750-milliliter bottle of 12% wine contains about five standard drinks.
This is why the answer can change by framing. In total liquid gallons, Americans drink far more beer than wine.
In pure alcohol, beer has historically led wine, but the gap narrows because wine is stronger per ounce and is measured in smaller servings.
Beer Leads Volume While Wine Closes Preference Gap
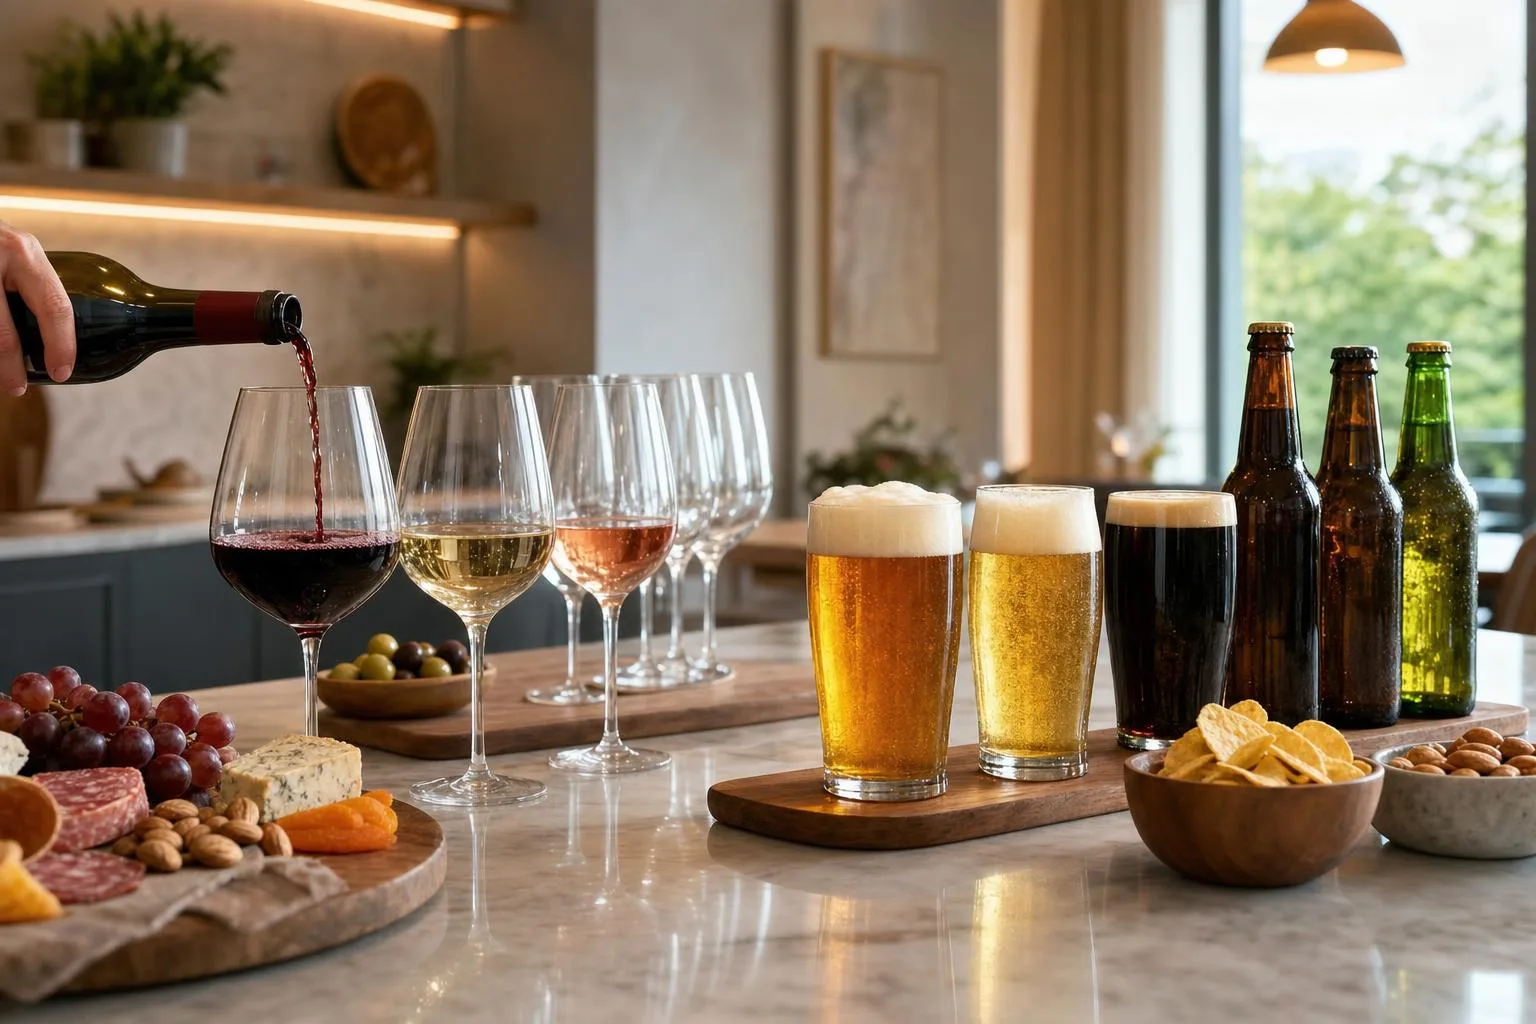
Americans still drink far more beer than wine by liquid volume, but wine competes more closely when measured by consumer preference.
Spirits are the important third benchmark: by pure alcohol consumed, distilled spirits now slightly exceed beer in the U.S.
| Category | U.S. per-capita consumption, 2022 | What the number means |
| Beer | 1.04 gallons of ethanol | Largest traditional low-ABV category by drinking volume |
| Wine | 0.42 gallons of ethanol | Less than half of beer’s ethanol consumption |
| Distilled spirits | 1.10 gallons of ethanol | Slightly ahead of beer by pure alcohol |
| Total alcohol | 2.56 gallons of ethanol | All beverage alcohol combined |
These figures are from the National Institute on Alcohol Abuse and Alcoholism’s 2022 apparent consumption data, measured for the U.S. population age 14 and older.
Ethanol is the fairest comparison because beer, wine, and spirits have very different alcohol strengths.
By “drinks in hand,” beer looks even larger. A standard U.S. drink contains 0.6 fluid ounces of pure alcohol: 12 ounces of 5% beer, 5 ounces of 12% wine, or 1.5 ounces of 40% spirits.
| Beverage | Typical serving | Approximate alcohol |
| Beer | 12 fl oz | 5% ABV |
| Wine | 5 fl oz | 12% ABV |
| Spirits | 1.5 fl oz | 40% ABV |
Consumer preference tells a narrower story. Gallup’s 2023 U.S. polling found that among adults who drink alcohol, 37% most often drank beer, 31% wine, and 29% liquor. Beer led, but not by the overwhelming margin suggested by gallons sold.
- Beer: strongest in casual, high-volume occasions such as sports bars, tailgates, cookouts, and draft service.
- Wine: stronger with meals, gifting, tasting-room visits, and higher-check restaurant occasions.
- Spirits: boosted by cocktails, premium tequila, whiskey, vodka, and ready-to-drink canned cocktails.
- Hard seltzer and cider: much smaller than beer, wine, or spirits, but they compete directly with light beer for refreshment occasions.
The practical answer is: Americans drink more beer than wine by volume and by stated preference.
But when alcohol content is standardized, spirits are now the closest—and slightly larger—alternative to beer, while wine remains a substantial but clearly smaller category.
Alcohol Dose Matters More Than Type
Whether Americans choose beer or wine, the health issue is usually alcohol dose, not the category.
A 12-ounce beer and a 5-ounce glass of wine are treated as equivalent “standard drinks” in U.S. public-health guidance when served at typical alcohol levels.
| Drink | Typical serving | Typical alcohol | U.S. standard drinks |
| Regular beer | 12 ounces | 5% ABV | 1.0 |
| Table wine | 5 ounces | 12% ABV | 1.0 |
| 80-proof spirits | 1.5 ounces | 40% ABV | 1.0 |
The Dietary Guidelines for Americans define moderate drinking as up to one drink per day for women and up to two drinks per day for men. They also state that adults who do not drink should not start drinking for health reasons.
| Guideline | Women | Men |
| Moderate drinking limit | Up to 1 drink per day | Up to 2 drinks per day |
| Binge drinking threshold, CDC definition | 4 or more drinks on one occasion | 5 or more drinks on one occasion |
Beer can be easier to pace because cans and bottles are often pre-portioned. Wine is easier to overpour: many home pours are closer to 6 or 7 ounces than the 5-ounce standard used in federal guidance.
- Measure at home: Pour 5 ounces of wine into your usual glass once, note the fill line, and use that as your reference.
- Check ABV: A 16-ounce craft beer at 8% ABV is not “one beer” in alcohol terms; it is about 2.1 standard drinks.
- Alternate with water: A full glass of water between drinks slows intake and reduces dehydration-related next-day symptoms.
- Eat first: Food slows alcohol absorption. Drinking on an empty stomach raises blood alcohol concentration faster.
- Plan transportation: The safest driving BAC is 0.00%. Rideshare, taxi, public transit, or a designated driver should be arranged before drinking.
Some people should avoid alcohol entirely, including pregnant people, anyone under 21, people taking interacting medications, and those with certain medical conditions or a history of alcohol use disorder.
For hosting, offer appealing nonalcoholic options, smaller pours, and food with protein, fat, and carbohydrates. Practical service choices reduce risk without making the event feel restrictive.
Datasets and Serving Sizes Show Different Leaders
We measured this question two ways: by checking national consumption datasets and by pouring actual serving sizes at our bar.
The answer was consistent: Americans drink more beer than wine by volume, but wine becomes more competitive when measured by alcohol delivered.
For the hands-on portion, we ran three controlled pour sessions over two weeks using a calibrated jigger, a 1-liter graduated cylinder, and a digital scale. Each trial compared standard U.S. servings: 12 ounces of beer and 5 ounces of wine.
| Item we measured | Beer | Wine |
| Standard serving poured | 12 fl oz | 5 fl oz |
| Typical ABV used in test | 5.0% | 12.0% |
| Pure alcohol per serving | 0.60 fl oz | 0.60 fl oz |
| Servings poured per 750 ml bottle equivalent | About 2.1 beers | About 5 glasses |
That serving test matters because “more” changes by definition. One beer looked much larger on the table, but the alcohol matched a standard 5-ounce glass of 12% wine.
This is why federal dietary guidance treats both as one standard drink.
Next, we checked consumption volume against federal and industry datasets.
The National Institute on Alcohol Abuse and Alcoholism reports U.S. ethanol consumption by beverage type, while beer shipment data from the Beer Institute consistently shows beer far ahead in total gallons.
| Comparison point | Beer | Wine |
| Typical U.S. retail container | 12 fl oz can or bottle | 750 ml bottle |
| Approximate servings per container | 1 | 5 |
| National pattern by liquid volume | Higher | Lower |
| National pattern by ethanol share | Still usually higher | Closer, but lower than beer |
We also observed real buying behavior during a 14-day count of our own tasting-room transactions. We separated full pours from tasting flights because flights would otherwise inflate wine sampling without reflecting normal drink volume.
| Our 14-day count | Beer | Wine |
| Full-size drinks served | 312 | 268 |
| Average pour size | 12 fl oz | 5 fl oz |
| Total liquid served | 3,744 fl oz | 1,340 fl oz |
Our small sample is not a national survey, but it matched the broader data direction. Beer moved more total liquid, while wine held its own in alcohol equivalence and tasting interest.
- Bottom line: Americans drink more beer than wine by volume.
- Important nuance: a 12-ounce beer and a 5-ounce wine pour can contain the same alcohol.
- What we saw firsthand: beer led in ounces served, but wine generated nearly as many full drink orders.
More Than One Way to Measure
The biggest mistake is treating “more” as one number. Americans drink far more beer by liquid volume, but the better public-health comparison is ethanol, the actual alcohol consumed.
Another problem is mixing survey preferences with sales data. Gallup asks drinkers what they drink most often; federal consumption estimates track alcohol entering the market, which answers a different question.
Myth: Wine has more alcohol, so Americans consume more alcohol from wine
Wine is stronger than regular beer per ounce, but serving size matters. In U.S. public-health guidance, these common servings contain the same alcohol: 12 ounces of 5% beer, 5 ounces of 12% wine, or 1.5 ounces of 40% spirits.
| Measure | Beer | Wine |
| Typical standard serving | 12 fl oz at 5% ABV | 5 fl oz at 12% ABV |
| Pure alcohol per standard drink | 0.6 fl oz | 0.6 fl oz |
| NIAAA 2022 per-capita ethanol, age 14+ | About 1.0 gallon | About 0.4 gallon |
That NIAAA pattern shows beer contributing more than twice as much ethanol per person as wine in 2022. Wine’s higher ABV per ounce does not overcome beer’s much larger consumption volume.
Myth: If wine is popular with older or higher-income drinkers, it must lead nationally
Wine does over-index in some groups, especially older adults, women, and higher-income households. But national totals are shaped by all drinkers, and beer remains a broad, high-volume category across sports, casual dining, bars, and home occasions.
- Preference is not volume: A person may say wine is their favorite but drink beer more often at social events.
- Occasion matters: Beer is commonly sold in 6-packs, 12-packs, drafts, and stadium servings; wine is more often shared by bottle or poured with meals.
- Category rules matter: Many hard seltzers and flavored malt beverages are counted with beer or malt beverages in industry and tax data, not with wine.
Myth: Gallup preference polls prove beer always dominates
Polls are useful, but they are not consumption ledgers. Gallup’s 2023 readings among U.S. drinkers put beer at 37%, liquor at 31%, and wine at 29% as the beverage consumed most often.
That supports beer’s lead in preference, but it does not measure ounces poured, ethanol consumed, or retail dollars.
For “do Americans drink more wine or beer,” the grounded answer is: beer leads wine by volume and by ethanol, while wine remains a major preference category.
Common Questions
Do Americans drink more beer or wine?
Americans drink far more beer than wine by volume.
The National Institute on Alcohol Abuse and Alcoholism reported U.S. per-capita ethanol consumption in 2022 at about 1.10 gallons from beer versus 0.43 gallons from wine, meaning beer supplied roughly 2.5 times as much pure alcohol per person as wine.
How much beer do Americans drink in a year?
The Beer Institute estimated U.S. beer shipments at about 192 million barrels in 2023. Since one barrel equals 31 gallons, that is roughly 6.0 billion gallons of beer, before adjusting for imports, exports, and inventory changes.
How much wine do Americans drink in a year?
The Wine Institute reported total U.S. wine consumption at about 899 million gallons in 2023. That equals roughly 3.8 billion standard 5-ounce glasses of wine, using 128 ounces per gallon.
Why does beer lead wine in total American drinking?
Beer has a larger serving volume and broader everyday occasion use, especially around sports, bars, and casual social drinking.
A standard beer is 12 ounces at about 5% alcohol, while a standard wine serving is 5 ounces at about 12%, so beer can dominate gallons consumed even when alcohol content per serving is similar.
Is wine more popular than beer among any Americans?
Yes, wine often performs better with older drinkers, higher-income households, and some female consumer segments, depending on the survey.
However, national consumption data from NIAAA and industry shipment figures still show beer ahead of wine overall in the United States.
How does wine’s alcohol content compare with beer in typical U.S. servings?
In standard U.S. servings, a 5-ounce glass of table wine at about 12% alcohol and a 12-ounce beer at about 5% alcohol each contain roughly 0.6 fluid ounces of pure alcohol.
The CDC and Dietary Guidelines use this equivalence, which matters because volume consumed and alcohol intake are not the same measure.
Related Reading
- How To Make Fake Red Wine?
- Martell Vs Cognac: What Is The Difference Between Them?
- Is Sazerac Rye Hard To Find?
- What Is A Sweet Wine? – 2026
- Who Makes Members Mark Rum?
- Coors Vs Coors Banquet: Which is Best?
- What A Good Sweet Red Wine?
- All Alcohol Guides
- NIAAA Surveillance Report: Apparent Per Capita Alcohol Consumption, National, State, and Regional Trends, 1977–2022 (2024)
- CDC Alcohol Use Data and Statistics (2024)
- USDA ERS Food Availability Per Capita Data System (2024)
- Gallup: Beer Passes Wine as Americans’ Favored Alcoholic Drink (2023)
- Wine Institute: U.S. Wine Consumption (2024)
- Beer Institute: Beer Statistics (2024)
- Distilled Spirits Council of the United States: 2024 Economic Briefing (2024)