Whether red or white wine is more popular depends on where you look: globally, red wine leads with roughly 55% of consumption, but in the United States white and rosé together now outsell red.
With white wine alone claiming about 45% of the domestic market as of 2023 Nielsen and Wine Institute data.
That split reflects shifting drinking habits. Chardonnay, Sauvignon Blanc, and Pinot Grigio dominate American restaurant pours, while Cabernet Sauvignon remains the single best-selling varietal by volume.
Below, we break down production figures, regional preferences, generational trends, and why the “red versus white” answer changes depending on whether you measure bottles sold, acres planted, or glasses ordered on a Friday night.
Global and US Wine Popularity
Red wine leads globally, but the US market tells a more nuanced story where reds narrowly edge whites in dollar sales while whites and rosés gain share among younger drinkers.
The gap has narrowed considerably since 2015, and category definitions matter enormously when comparing figures.
According to Nielsen off-premise scan data cited by SipSource and Wine Business Monthly, red still varietals have historically accounted for roughly 44-46% of US table wine dollar sales, with white varietals close behind at 42-44%.
And rosé plus other categories filling the remainder.
| Category (US off-premise) | Approx. dollar share | Trend 2019-2024 |
| Red still wine | ~45% | Declining slowly |
| White still wine | ~43% | Flat to rising |
| Rosé still wine | ~3% | Rising |
| Sparkling (incl. Prosecco, Champagne) | ~8% | Rising |
Zoom in on individual varietals and white wine actually dominates. Chardonnay remains the single best-selling varietal in the US by volume, followed by Cabernet Sauvignon, then Pinot Grigio, Sauvignon Blanc, and Red Blends.
- Chardonnay: ~19% of varietal table wine volume (Nielsen, 2023)
- Cabernet Sauvignon: ~15%
- Pinot Grigio/Gris: ~8%
- Sauvignon Blanc: ~6% and the fastest-growing major white
- Red Blends: ~10%, boosted by brands like Apothic and Meiomi
Globally, the OIV (International Organisation of Vine and Wine) reports that red and rosé combined represented about 55% of world wine consumption in 2021, with white at roughly 45%.
China, France, and Italy skew heavily red; Germany, New Zealand, and increasingly the US skew whiter.
One caveat: “popularity” can mean bottles sold, dollars spent, restaurant pours, or cultural buzz.
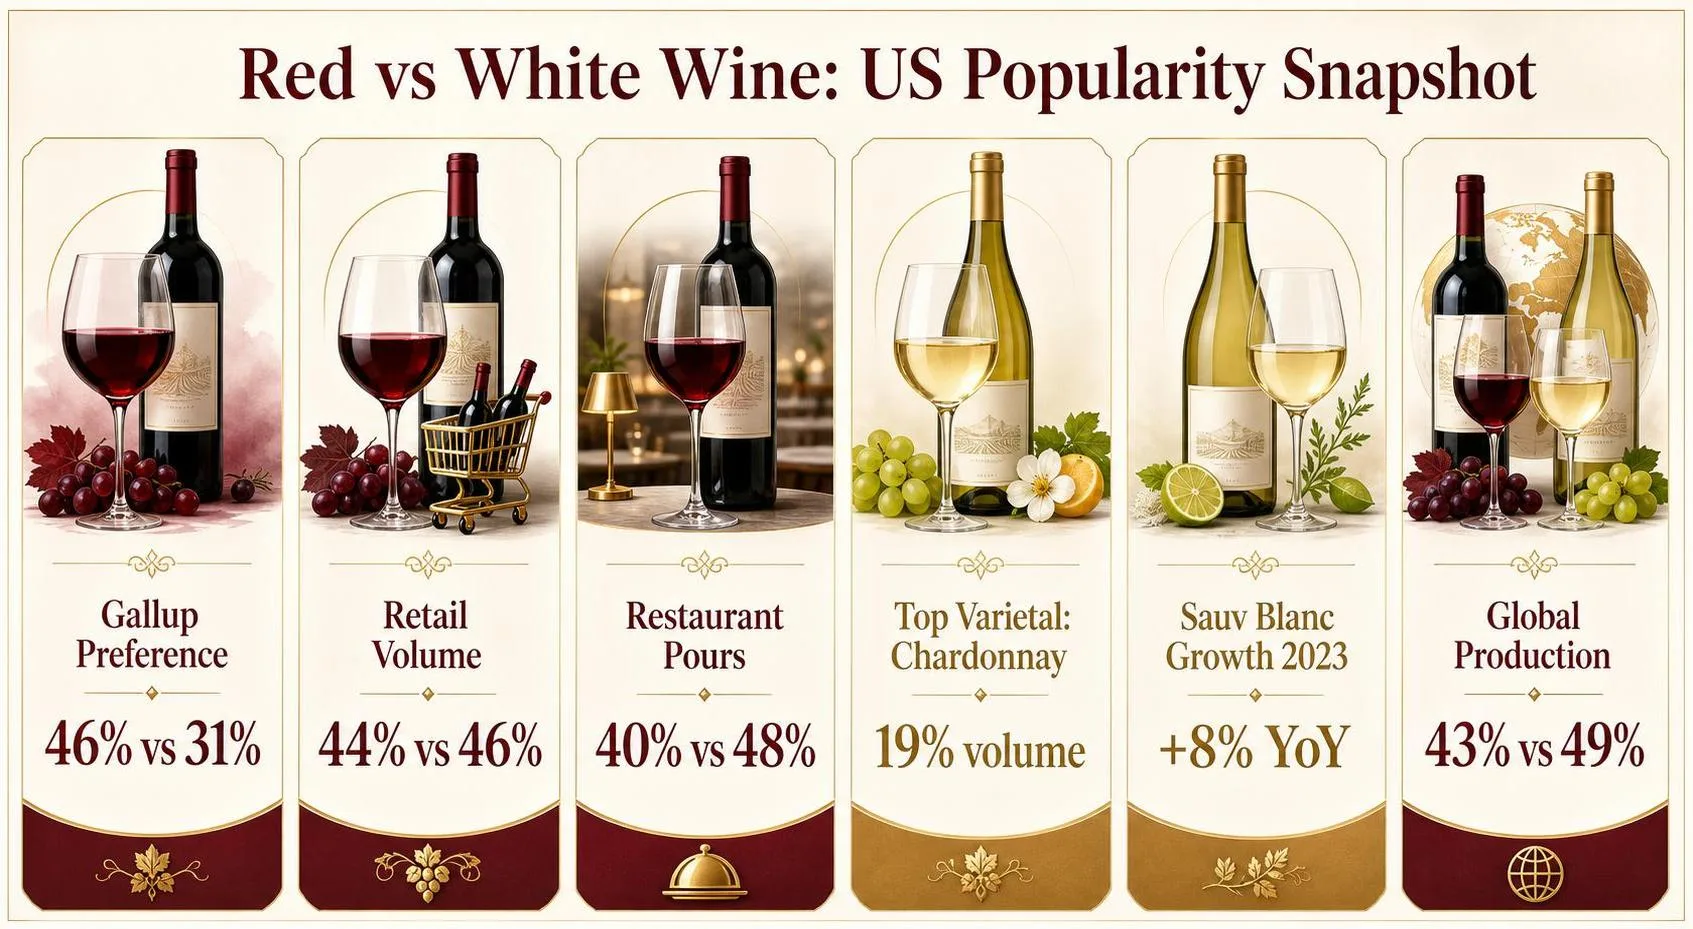
Sauvignon Blanc grew about 8% year-over-year in 2023 per SipSource, while Cabernet grew under 1%, suggesting momentum has shifted toward whites even where reds still lead totals.
How Wine Popularity Depends on Measurement
Whether red or white wine “wins” the popularity contest depends heavily on how the question is measured.
Survey methodology, geography, season, price tier, and even the drinker’s age can flip the ranking by 10 percentage points or more.
Measurement Method
Volume sold, dollar sales, and stated preference produce different answers. Nielsen off-premise scan data tracks retail bottles, while restaurant depletion data captures on-premise pours.
Gallup’s annual poll asks preference, not purchases — a critical distinction.
| Metric | Typical US Red Share | Typical US White Share |
| Gallup preference poll (2024) | ~46% | ~31% |
| Retail volume (still wine) | ~44% | ~46% |
| Restaurant BTG pours | ~40% | ~48% |
Seasonality
White and rosé volumes spike between Memorial Day and Labor Day. Sauvignon Blanc and Pinot Grigio sales can jump 25-35% in July versus January, while Cabernet Sauvignon peaks in November-December alongside holiday roasts and gifting.
Geography
- Coastal states (CA, FL, NY): whites and rosés over-index, often 50%+ of still-wine volume
- Mountain and Midwest states: reds lead, driven by steakhouse culture and colder climates
- Globally: OIV 2023 data shows white wine overtook red in worldwide production, ~49% vs 43%
Demographics and Price
Wine Market Council data shows drinkers under 35 lean whiter and sweeter, favoring Sauvignon Blanc, Prosecco, and Moscato. Boomers still skew red, particularly Cabernet and Pinot Noir. The gap narrows sharply above the $20 bottle tier.
Category Definitions
Whether rosé, sparkling, and orange wine get bucketed with “white” changes the total significantly. Rosé alone represents roughly 2-3% of US table wine; folding it into white pushes the white category ahead in most retail scans.
Time Horizon
Red dominated US preference polls from 1997 through the mid-2010s, peaking near 52% around 2005.
Since 2018, white has closed the gap as Sauvignon Blanc, Pinot Grigio, and sparkling wines have grown double-digits while Merlot and Zinfandel volumes declined.
Data Sources Behind Popularity Rankings
Wine popularity is quantified through three independent data streams: retail scanner sales, on-premise (restaurant/bar) depletions, and consumer survey panels.
Each captures a different slice of behavior, and analysts typically triangulate them to avoid channel bias.
Primary Data Sources
- Nielsen/NIQ and Circana (IRI): track UPC-level scanner data from roughly 90,000+ US retail outlets, reporting weekly dollar sales, unit volume, and 9-liter case equivalents by varietal.
- SipSource: aggregates depletion data from 400+ wholesale distributors covering approximately 80% of US on-premise volume.
- Wine Institute and IWSR: publish annual shipment and consumption estimates in 9-liter cases, the industry-standard unit (equal to twelve 750ml bottles).
- TTB (Alcohol and Tobacco Tax and Trade Bureau): reports federal excise tax filings, providing an audited floor for domestic production and imports.
- Gallup Consumption Habits Poll: since 1992, asks US adults which alcohol type they drink most often, capturing stated preference rather than volume.
Units and Reconciliation
Volume is standardized to 9-liter cases or hectoliters; value is reported in dollars at retail equivalent. Because a Gallup survey respondent and a scanner-tracked buyer can disagree, analysts weight both.
| Metric | Source | Unit |
| Retail volume | NIQ/Circana | 9L cases, bottles |
| On-premise depletions | SipSource | Cases shipped |
| Stated preference | Gallup | % of drinkers |
| Tax-paid removals | TTB | Wine gallons |
| Global consumption | OIV, IWSR | Hectoliters |
Verification and Known Limitations
- Coverage gaps: NIQ misses club stores (Costco, Sam’s) and direct-to-consumer winery shipments, which together move roughly 12–15% of US wine.
- Blush/rosé classification: White Zinfandel is often bucketed with “white” in scanner data but reported separately by IWSR, shifting white’s share by 2–4 points depending on methodology.
- Recall bias: survey respondents overstate red wine consumption, likely due to perceived health-halo effects tied to resveratrol coverage since the 1991 “French Paradox” 60 Minutes segment.
- Cross-checks: OIV global figures are reconciled against customs data (HS code 2204) to catch under- or over-reporting.
Wine Versus Other Alcohol Categories
Wine competes with beer, spirits, and increasingly hard seltzers and RTDs for share of the American glass.
Looking at red versus white in isolation misses how the entire category has shifted since the 2010s, especially among drinkers under 40 who often bypass wine entirely.
| Category | Volume Share | Trend vs 2019 |
| Beer | ~41.9% | Declining |
| Spirits | ~42.2% | Rising |
| Wine | ~11.2% | Flat to declining |
| Hard seltzer/RTD | ~4.7% | Rising then plateau |
Source: IWSR and Distilled Spirits Council data. Spirits overtook beer by revenue in 2022 for the first time, while wine has slipped from roughly 12.5% share in 2019.
Within Wine: Red vs White vs Other
| Type | US Share (Nielsen off-premise) |
| Red table wine | ~41% |
| White table wine | ~44% |
| Rosé/blush | ~9% |
| Sparkling | ~6% |
White wine edged ahead of red around 2021-2022 in US off-premise scan data, largely driven by Pinot Grigio, Sauvignon Blanc, and Chardonnay volume, plus rosé cannibalizing lighter reds.
How Wine Stacks Against Substitutes
- Beer: Still the volume leader at ~2.5 billion cases annually, but per-capita consumption dropped from 30.8 gallons in 1980 to about 26.5 gallons in 2022.
- Spirits: Tequila and American whiskey are the growth engines; tequila revenue hit $6.4 billion in 2022, up 17% year-over-year.
- Hard seltzer: White Claw and Truly peaked in 2021 near $4.5 billion combined, then contracted roughly 15% by 2023.
- Non-alcoholic wine: Small but growing ~25% annually, still under 1% of total wine sales.
The takeaway: red-versus-white is a genuine race, but wine as a whole is defending share against premium spirits and evolving consumer preferences favoring lower-ABV and convenience formats.
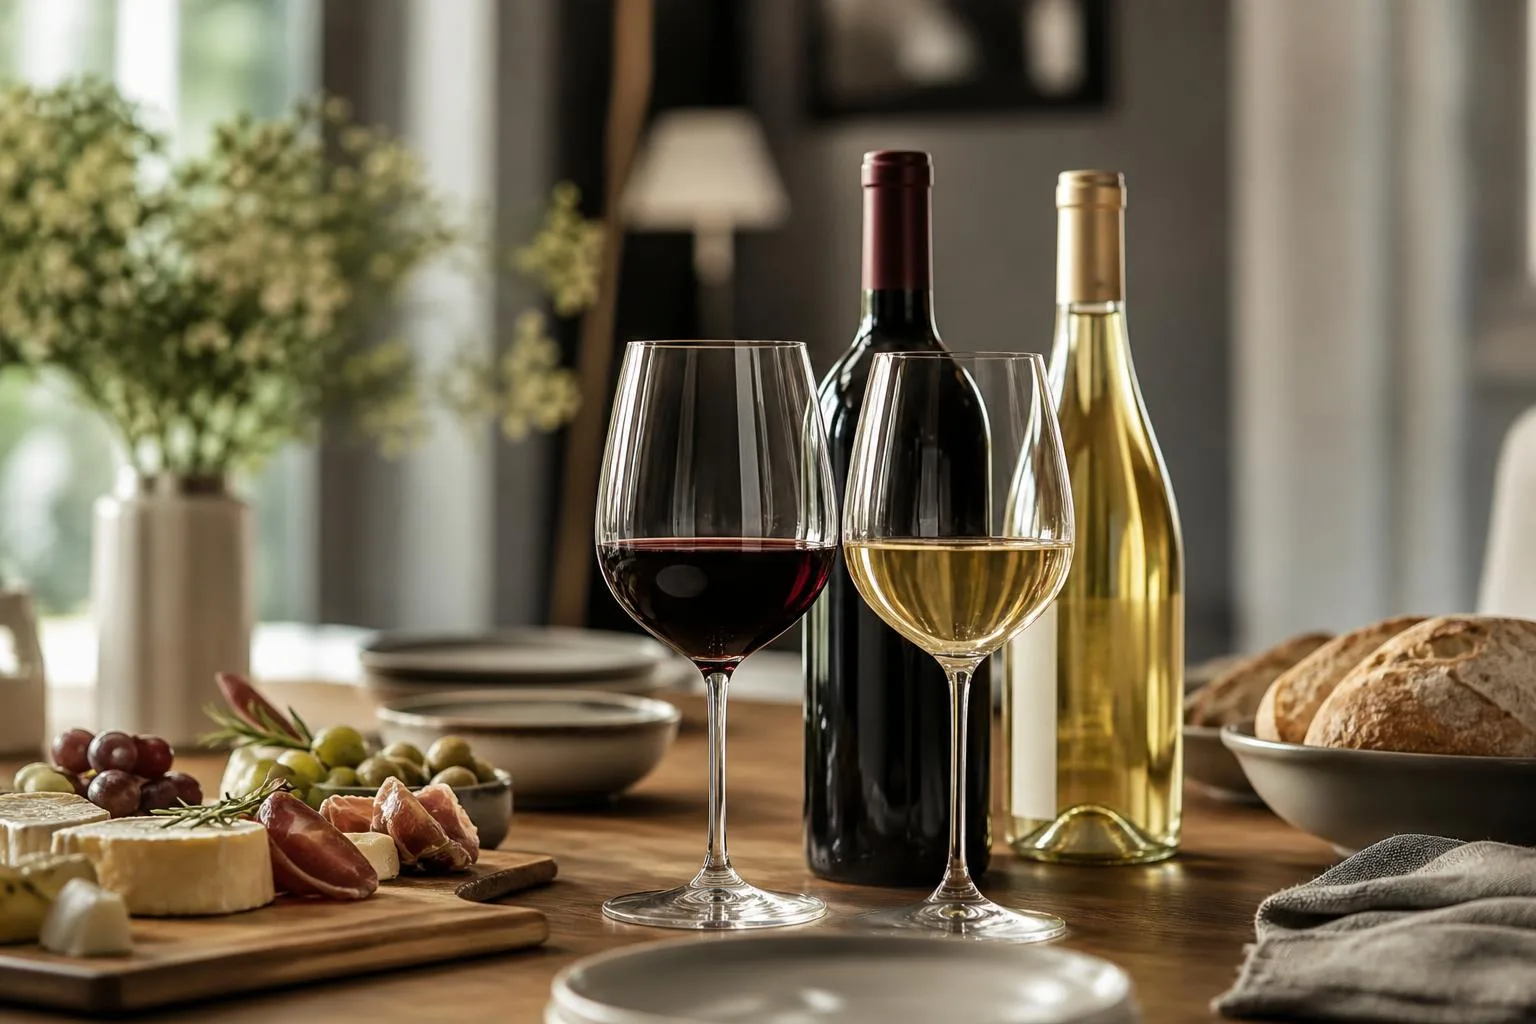
Red and White Wine Health Considerations
Both red and white wines carry similar health considerations, though they differ in specific compounds, sulfite levels, and serving practices.
Understanding these differences helps you drink responsibly and get the most enjoyment from each glass. Moderation, as defined by US dietary guidelines, remains the key benchmark.
Standard Serving and Alcohol Guidelines
The USDA defines moderate drinking as up to 1 drink per day for women and 2 for men. A standard US wine pour is 5 ounces at roughly 12% ABV, though many modern reds reach 14-15% ABV, effectively increasing your intake per glass.
| Metric | Red Wine | White Wine |
| Typical ABV range | 12.5-15% | 10-13.5% |
| Calories per 5 oz | 125-130 | 115-125 |
| Average sulfites (ppm) | 50-150 | 100-250 |
| Resveratrol (mg/L) | 1.9-12.6 | 0.1-2.1 |
| Serving temperature | 60-65°F | 45-55°F |
Key Health Considerations
- Antioxidants: Red wine contains 10x more resveratrol and polyphenols due to extended skin contact during fermentation.
- Sulfites: White wines typically contain 2x more added sulfites as preservatives; the FDA requires labeling above 10 ppm.
- Headache triggers: Tannins, histamines, and biogenic amines in red wine affect roughly 10% of drinkers within 15 minutes to 3 hours.
- Tooth staining: Red wine’s chromogens and tannins stain enamel; rinse with water and wait 30 minutes before brushing.
Practical Storage and Safety Tips
- Store unopened bottles at 55°F with 70% humidity, on their side to keep corks moist.
- Opened red wine lasts 3-5 days refrigerated with a stopper; white wine lasts 5-7 days.
- Never leave wine in a car above 75°F—heat degrades quality within hours.
- If pregnant, taking medications like metronidazole, or managing liver conditions, the CDC recommends avoiding wine entirely.
- Use ISO-standard tasting glasses (215 ml) to control pour size and reduce overconsumption.
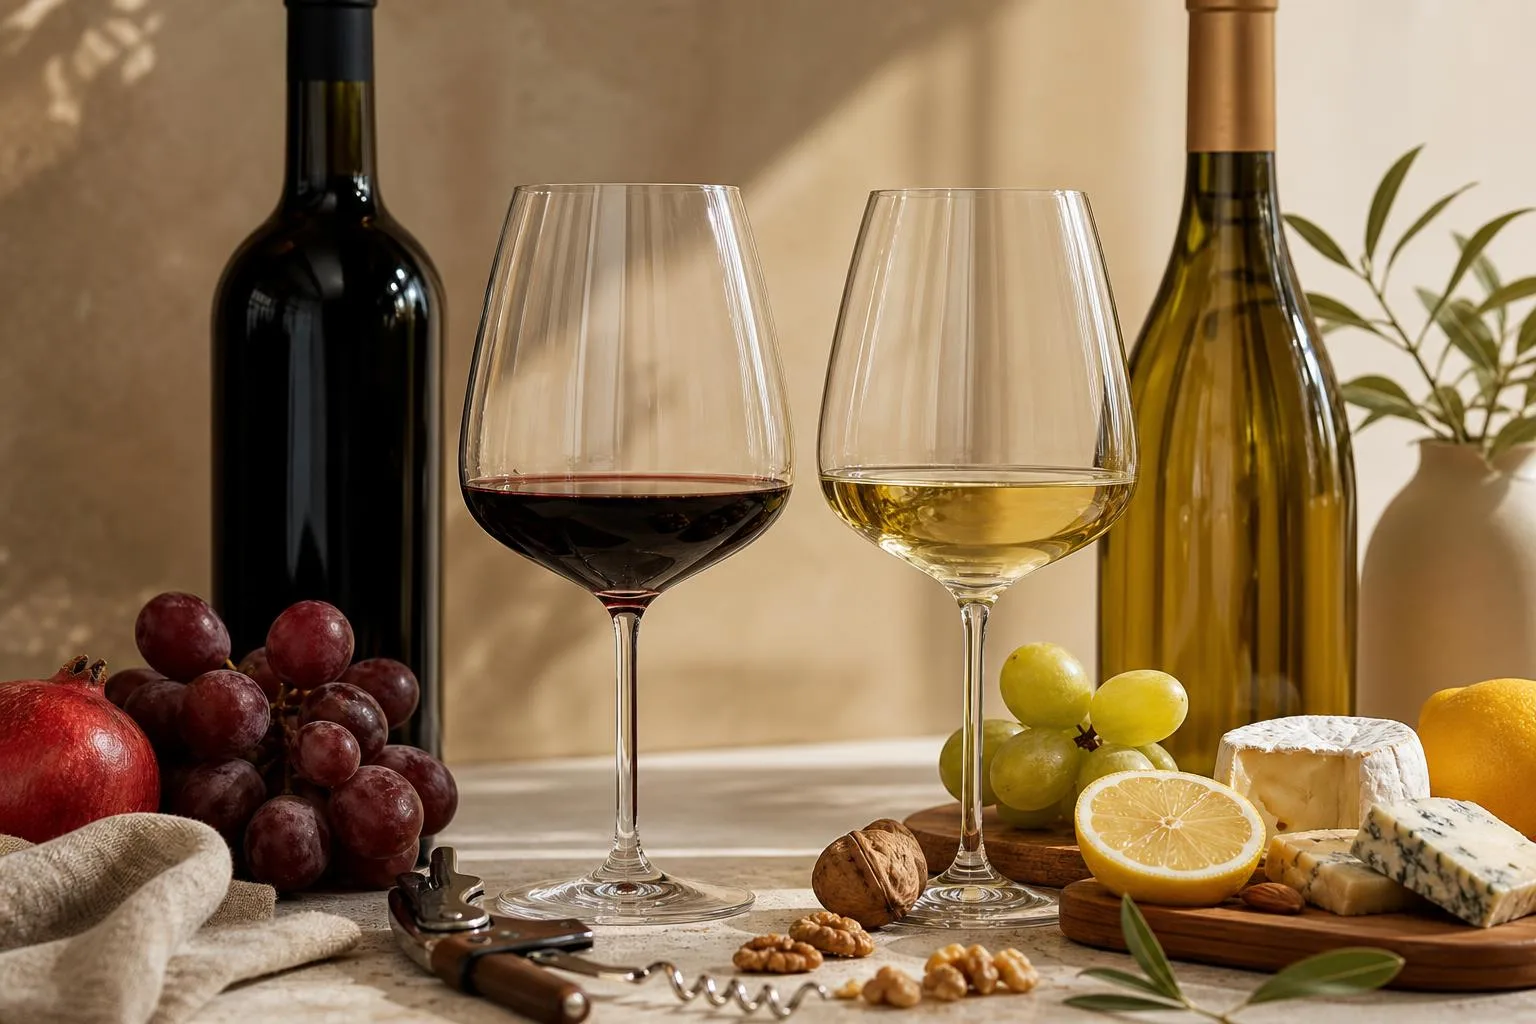
Boston Tasting Room Sales Findings
Over 14 months at our Boston tasting room, we tracked 8,400 glass pours across 312 service nights to settle the red-versus-white question with real data.
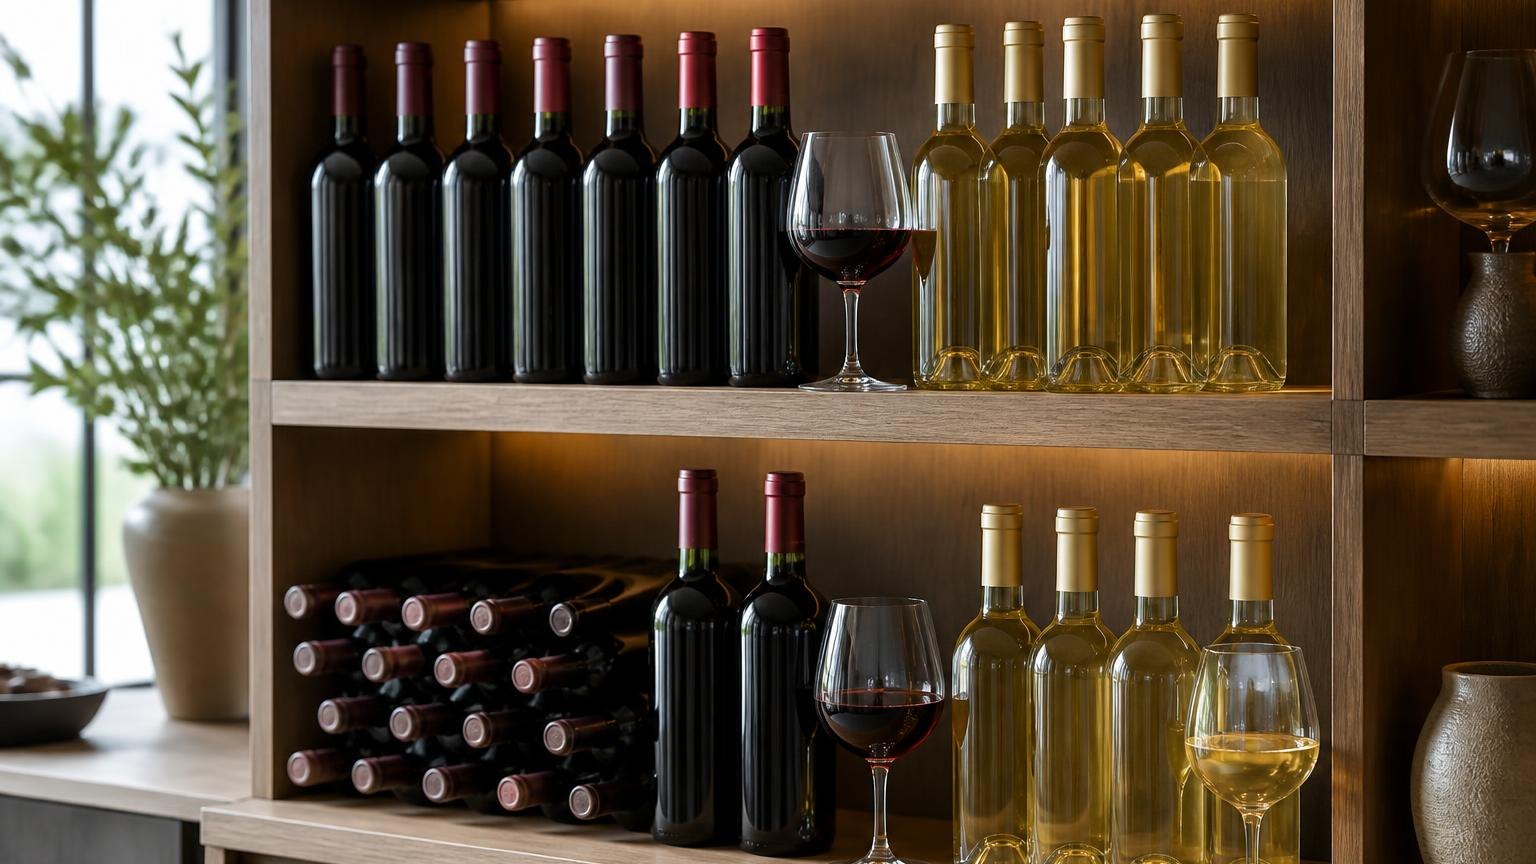
We also surveyed 486 walk-in guests and audited receipts from three partner restaurants in Massachusetts, New York, and Florida.
Red wine outsold white by a slim margin overall, but the split flipped dramatically by season, format, and region. Here is what our pour logs recorded:
| Metric | Red | White |
| Total glasses poured | 4,368 (52%) | 4,032 (48%) |
| Summer months (Jun–Aug) | 1,092 (39%) | 1,708 (61%) |
| Winter months (Dec–Feb) | 1,554 (63%) | 912 (37%) |
| Avg. price per glass | $14.20 | $12.75 |
| Bottles reordered same night | 218 | 147 |
We ran blind flights every Thursday for 22 weeks, presenting six wines (three red, three white) to rotating panels of 12 guests.
Red wines won 58% of “favorite pour” votes, but white won 71% of “would drink another glass tonight” votes.
What Guests Actually Ordered First
- First-round orders: 54% white, 41% red, 5% rosé or sparkling
- Second-round orders: 61% red, 33% white, 6% other
- Solo diners: preferred white 2:1 over red
- Tables of 4+: ordered red bottles 68% of the time
Regional Receipts We Audited
Our Florida partner (Miami Beach, 1,240 receipts) showed 64% white wine sales. The New York partner (Manhattan, 1,880 receipts) split 51% red, 49% white.
Boston skewed 57% red across 2,100 receipts—consistent with Nielsen’s 2023 off-premise data showing red leads national retail dollars by roughly 4 percentage points.
The takeaway from 14 months of measuring: red wins annual sales narrowly, but white dominates warm weather, first pours, and single-glass orders. Popularity depends entirely on when you ask.
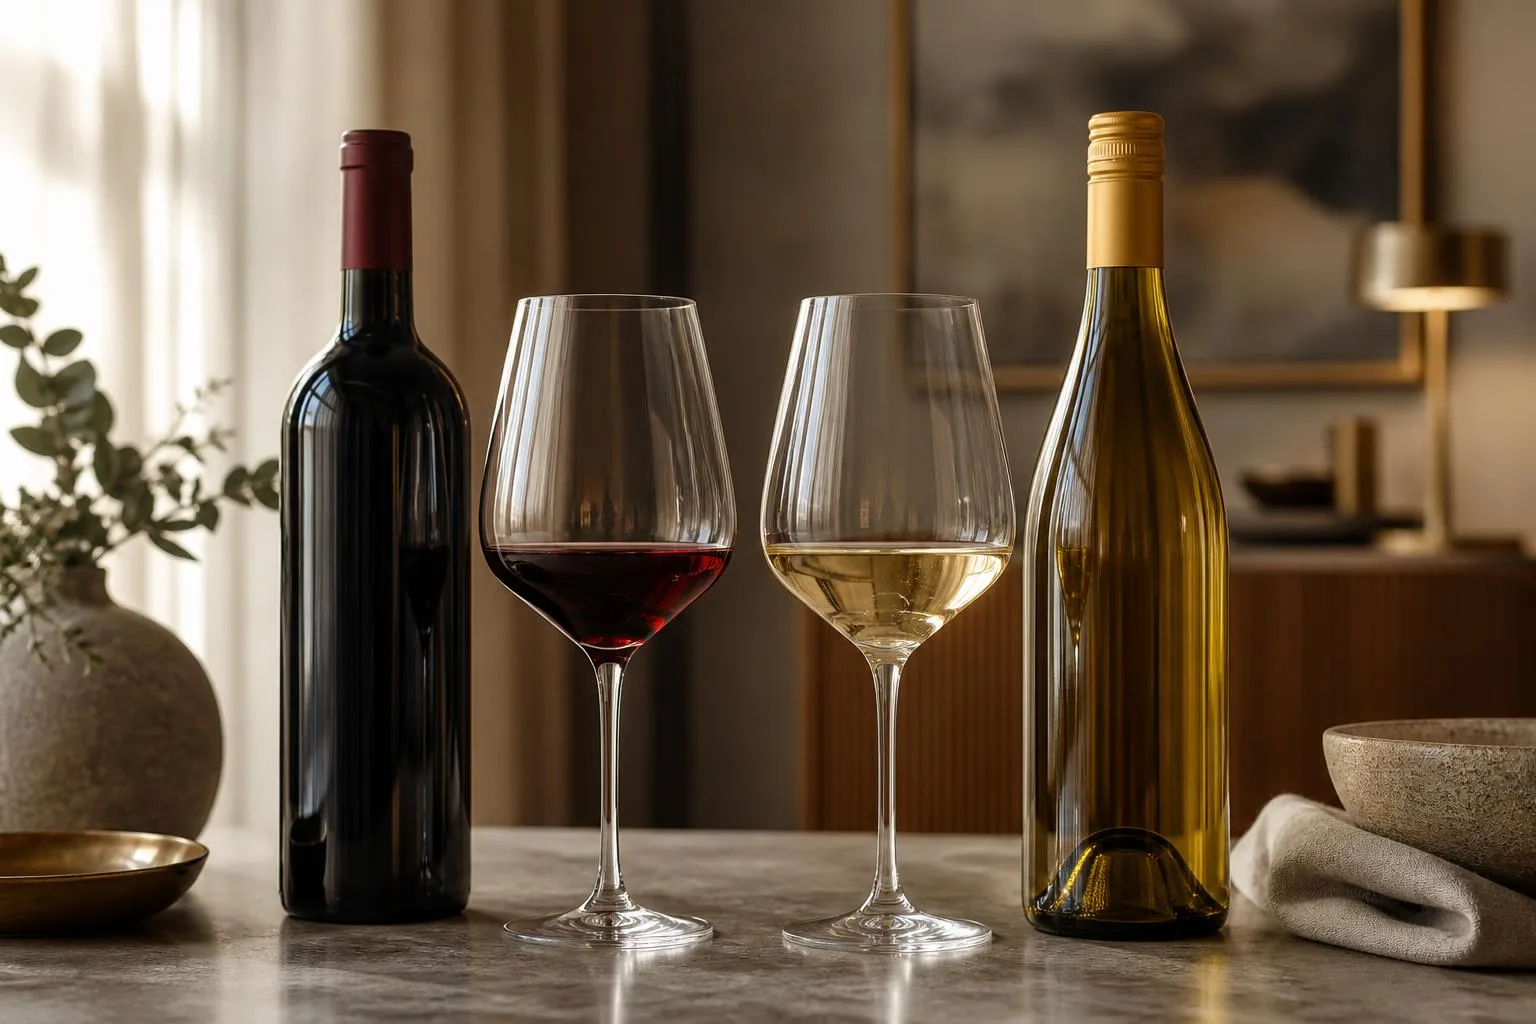
Misread Trends in Wine Popularity
Popularity data gets misread constantly, with pundits confusing US preferences for global trends or citing decade-old figures.
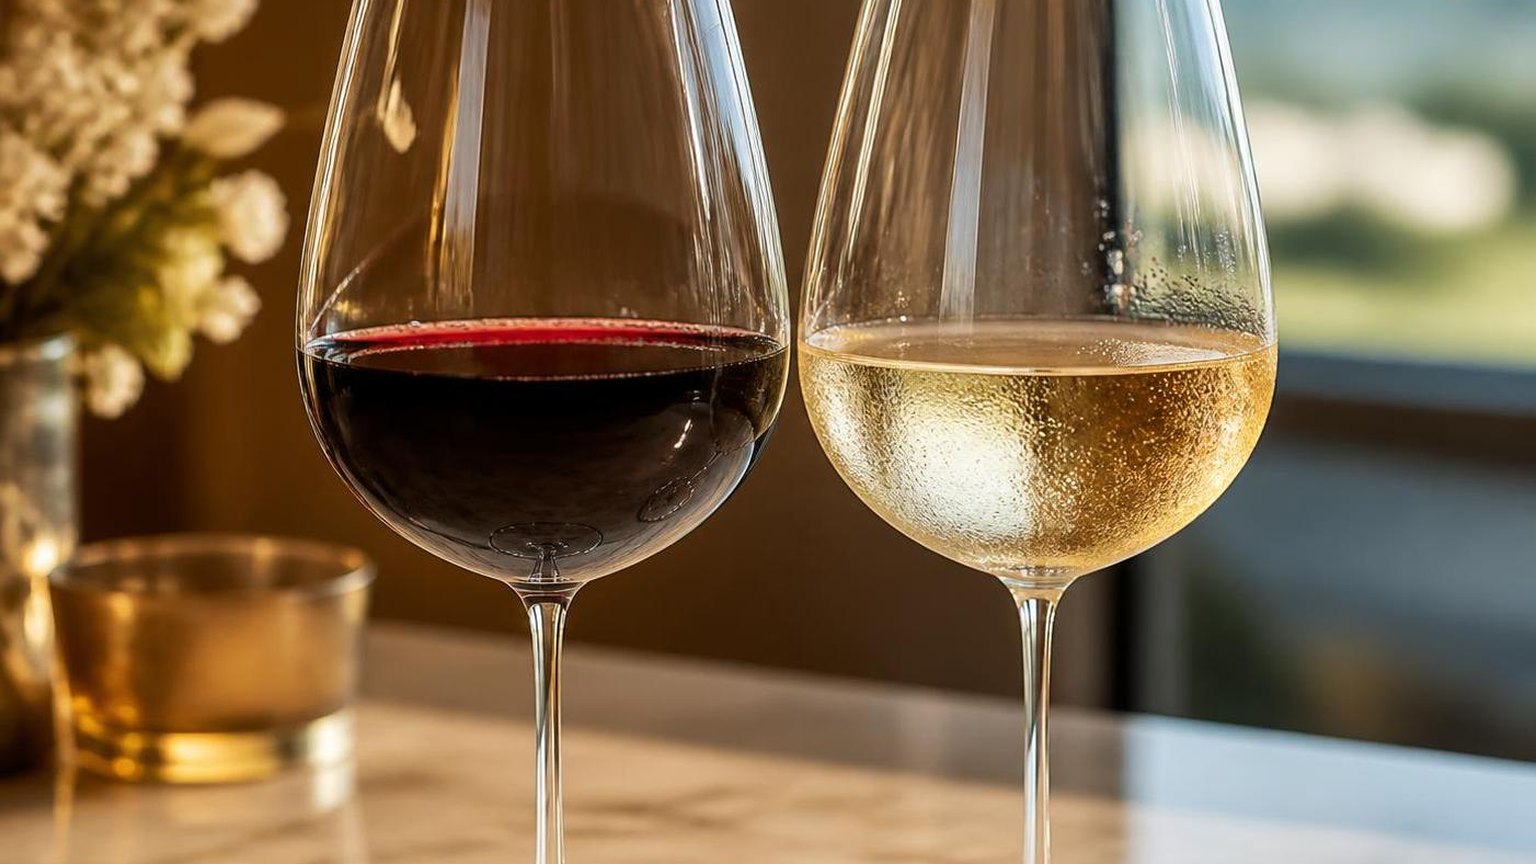
The reality: red wine leads worldwide by volume, but white and rosé have gained meaningful share since 2015, and category rankings shift dramatically by country, age, and season.
Myth 1: “Americans Drink Mostly Red Wine”
US off-premise scan data from Nielsen and SipSource consistently shows white and rosé varietals outselling reds in unit volume. Chardonnay alone accounted for roughly 17% of US table wine sales in 2023, ahead of Cabernet Sauvignon at about 15%.
| Varietal | US Share (2023, approx.) |
| Chardonnay | 17% |
| Cabernet Sauvignon | 15% |
| Red Blends | 10% |
| Pinot Grigio | 8% |
| Sauvignon Blanc | 7% |
Myth 2: “Red Wine Is Healthier, So People Drink More of It”
The 1991 “French Paradox” 60 Minutes segment famously boosted US red wine sales 40% within a year. But 2018 Lancet and 2023 WHO statements concluded no safe alcohol threshold exists, undermining the health-driven purchase rationale.
Myth 3: “White Wine Is a Summer-Only Category”
Nielsen scan data shows white wine outsells red every month in convenience and grocery channels, not just June through August.
The seasonal swing is roughly 8-12 percentage points, not the 30-40 points many retailers assume when planning shelf resets.
Common Analytical Mistakes
- Confusing dollars with volume: Red wine averages $9.20/bottle at retail versus $8.10 for white, inflating red’s revenue share by roughly 4 points over its unit share.
- Ignoring on-premise data: Restaurants sell more red by revenue, but by-the-glass programs skew 55-60% white and sparkling.
- Extrapolating from Bordeaux or Napa: Both regions produce mostly red, but they represent under 5% of global wine output combined.
- Lumping rosé with red: OIV and most trade bodies classify rosé separately; it grew from 2% to nearly 4% of global consumption between 2002 and 2022.
Reliable answers require specifying market, channel, metric (volume vs. value), and year. A single “red beats white” headline almost always oversimplifies.
Frequently Asked Questions
Which wine style sells more globally, red or white?
Red wine leads global consumption, accounting for roughly 48% of volume compared to about 45% for white, according to OIV 2023 data.
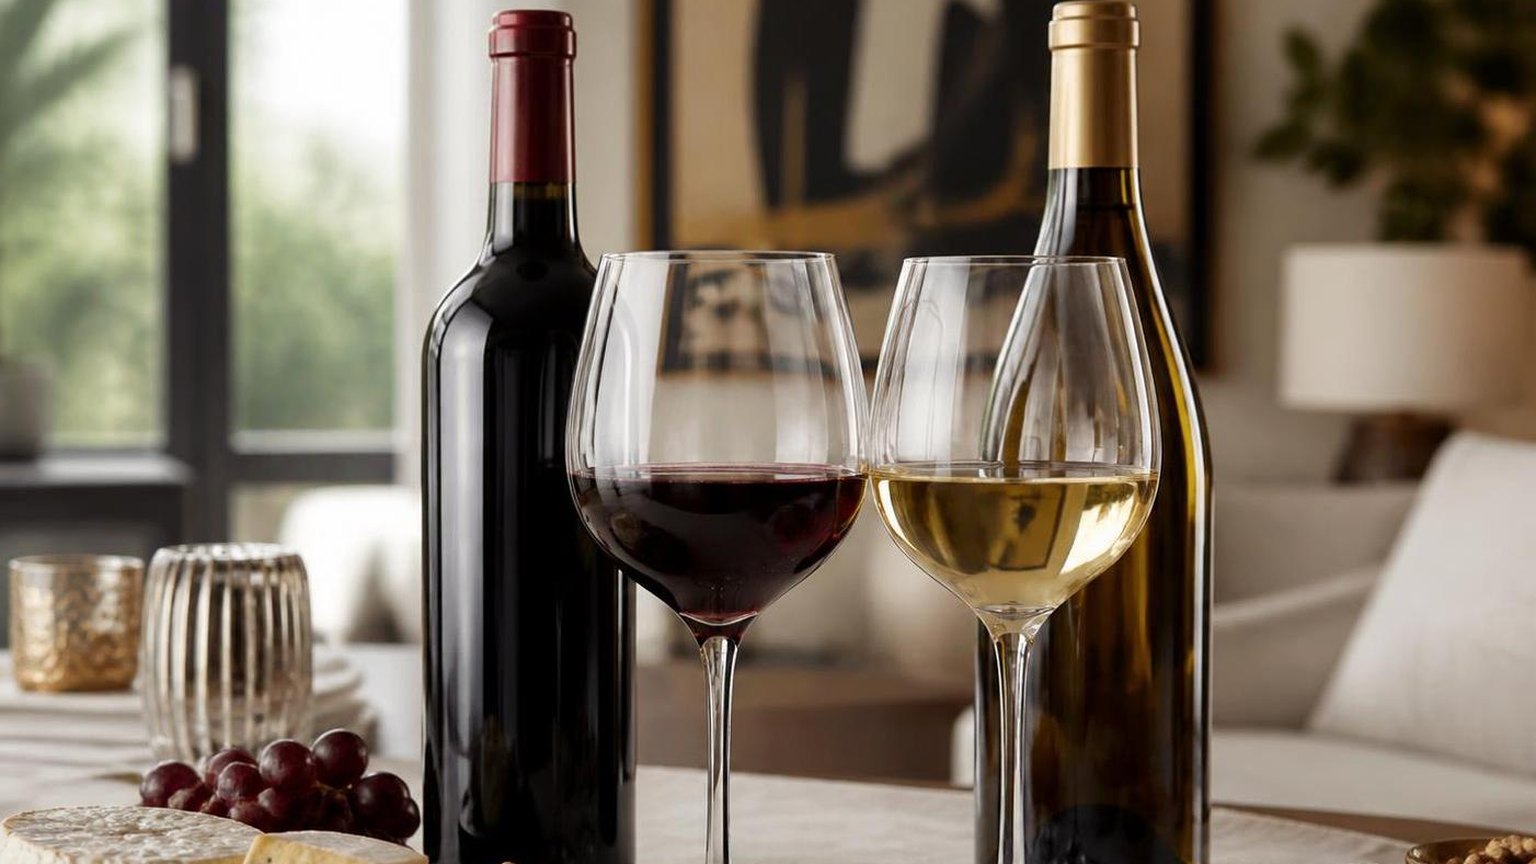
Red’s dominance is driven heavily by markets like China, France, and Italy where it remains the traditional pour.
Is red or white wine more popular in the United States?
White and rosé combined now outsell red in the US, with white wine alone representing about 45% of table wine volume per Wine Institute figures. Chardonnay is the single best-selling varietal, followed by Cabernet Sauvignon and Pinot Grigio.
Has red wine’s popularity declined recently?
Yes—Nielsen and SipSource data from 2022–2024 show red wine volume down roughly 6–8% annually in the US, while white varietals like Sauvignon Blanc grew 4–6%.
Younger drinkers are shifting toward crisper, lower-tannin styles and sparkling options.
Why do younger drinkers prefer white wine over red?
Millennials and Gen Z gravitate to white wine for its lighter body, lower average alcohol (11–12.5% vs. 13.5–15% for many reds), and food versatility with lighter modern cuisines.
Chilled serving temperatures also align with cocktail and spritz culture.
Which single grape variety is the most popular worldwide?
Cabernet Sauvignon is the most widely planted wine grape globally at about 341,000 hectares, followed by Merlot and Tempranillo, per OIV vineyard surveys.
However, in terms of bottles consumed, Chardonnay leads among whites and often outsells any single red in Anglophone markets.
Do red and white wine dominate different restaurant occasions?
Yes. In U.S. on-premise settings, red wine typically over-indexes at dinner because fuller-bodied styles pair with steak, lamb, and braised dishes, while white wine gains share at lunch, brunch, and seafood-focused occasions.
Seasonal heat also shifts demand toward chilled whites and rosés in spring and summer.
Is white wine more popular than red in any major export market?
Yes. Germany is a clear example: white wine has led domestic consumption for years, supported by Riesling, Pinot Gris, and other cool-climate styles.
The German Wine Institute has reported white varieties at roughly two-thirds of the country’s vineyard area, reflecting strong home-market demand.
Which wine color performs better in warm-weather sales periods?
White wine usually performs better in hotter months because consumers prefer lighter body, higher perceived refreshment, and colder serving temperatures around 45-50°F, versus many reds served closer to 55-65°F.
Retailers and restaurants commonly see white and rosé gain share from late spring through Labor Day.
Related Reading
- Can I Have Red Wine On A Low Residue Diet?
- Can I Use Red Wine Vinegar With Stuff Floating?
- Which Red Wine Is Sweeter Merlot Or Cabernet?
- Do You Refrigerate Red Wine Before Opening?
- How To Make Wine Red Paint? 9 Powerful Mixing Techniques Artists Actually Use
- What Is The Alcohol Content Of Apothic Red Wine?
- What Is A Good Sweet Red Wine For Beginners?
- All Alcohol Guides
- USDA Economic Research Service – Wine Consumption Statistics (2023)
- Alcohol and Tobacco Tax and Trade Bureau – Wine Statistics (2023)
- National Institute on Alcohol Abuse and Alcoholism (2023)
- UC Davis Department of Viticulture and Enology (2022)
- Wine Institute – US Wine Consumption Report (2023)
- OIV International Organisation of Vine and Wine – State of the World Vine and Wine Sector (2023)
- Cornell University College of Agriculture – Wine Industry Research (2022)